Estimated Value: $289,915 - $356,000
4
Beds
2
Baths
1,905
Sq Ft
$172/Sq Ft
Est. Value
About This Home
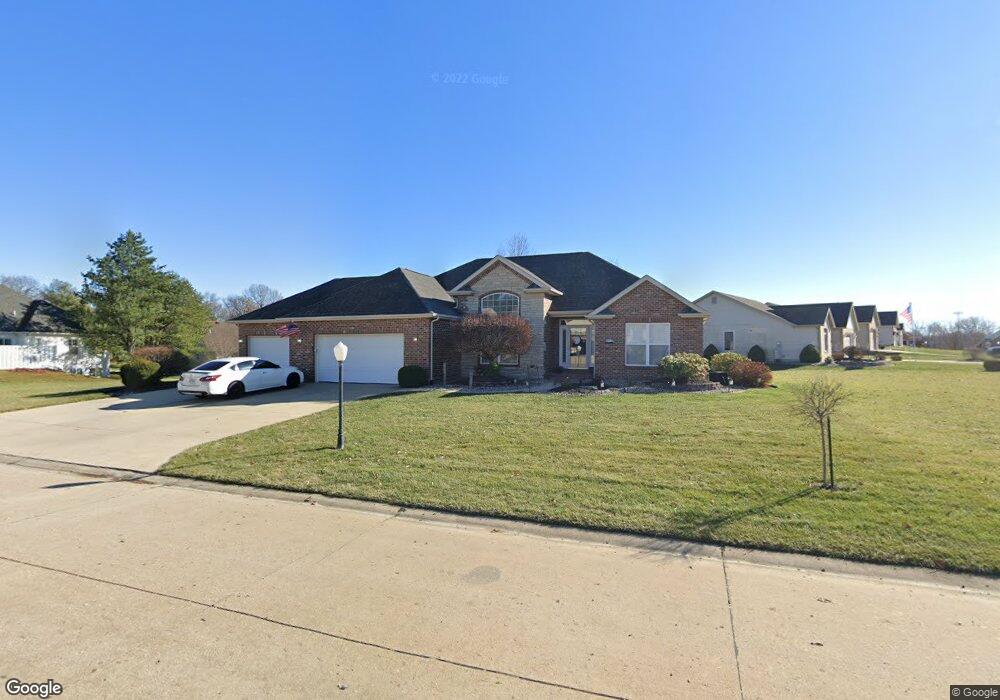
This home is located at 2017 Savannah Trace, Alton, IL 62002 and is currently estimated at $327,729, approximately $172 per square foot. 2017 Savannah Trace is a home located in Madison County with nearby schools including Eunice Smith Elementary School, Alton Middle School, and Alton High School.
Ownership History
Date
Name
Owned For
Owner Type
Purchase Details
Closed on
Jul 10, 2025
Sold by
Ballard Brett
Bought by
Ballard Brett and Czerny Jamie
Current Estimated Value
Purchase Details
Closed on
Feb 10, 2014
Sold by
Ballard Brett and Ballard Amy
Bought by
Ballard Brett
Purchase Details
Closed on
Aug 18, 2005
Sold by
Freshour Darren
Bought by
Ballard Brett and Ballard Amy
Home Financials for this Owner
Home Financials are based on the most recent Mortgage that was taken out on this home.
Original Mortgage
$211,166
Interest Rate
7.68%
Mortgage Type
Fannie Mae Freddie Mac
Purchase Details
Closed on
Jan 11, 2005
Sold by
Pratt Judith A
Bought by
Freshour Darren
Home Financials for this Owner
Home Financials are based on the most recent Mortgage that was taken out on this home.
Original Mortgage
$150,000
Interest Rate
5.9%
Mortgage Type
Construction
Purchase Details
Closed on
Feb 27, 2003
Sold by
Savannah Trace Inc
Bought by
Pratt Judith A
Create a Home Valuation Report for This Property
The Home Valuation Report is an in-depth analysis detailing your home's value as well as a comparison with similar homes in the area
Purchase History
| Date | Buyer | Sale Price | Title Company |
|---|---|---|---|
| Ballard Brett | -- | Serenity Title & Escrow Ltd | |
| Ballard Brett | -- | Attorney | |
| Ballard Brett | $235,000 | -- | |
| Freshour Darren | $35,500 | -- | |
| Pratt Judith A | $32,000 | Fatic |
Source: Public Records
Mortgage History
| Date | Status | Borrower | Loan Amount |
|---|---|---|---|
| Previous Owner | Ballard Brett | $211,166 | |
| Previous Owner | Freshour Darren | $150,000 | |
| Closed | Freshour Darren | $35,500 |
Source: Public Records
Tax History
| Year | Tax Paid | Tax Assessment Tax Assessment Total Assessment is a certain percentage of the fair market value that is determined by local assessors to be the total taxable value of land and additions on the property. | Land | Improvement |
|---|---|---|---|---|
| 2024 | $6,032 | $95,470 | $17,700 | $77,770 |
| 2023 | $5,730 | $88,140 | $16,340 | $71,800 |
| 2022 | $5,730 | $80,600 | $14,940 | $65,660 |
| 2021 | $5,197 | $75,800 | $14,050 | $61,750 |
| 2020 | $5,094 | $74,160 | $13,750 | $60,410 |
| 2019 | $5,207 | $72,220 | $13,390 | $58,830 |
| 2018 | $5,142 | $69,140 | $12,820 | $56,320 |
| 2017 | $4,889 | $69,140 | $12,820 | $56,320 |
| 2016 | $4,749 | $69,140 | $12,820 | $56,320 |
| 2015 | $4,260 | $66,970 | $12,420 | $54,550 |
| 2014 | $4,260 | $66,970 | $12,420 | $54,550 |
| 2013 | $4,260 | $66,970 | $12,420 | $54,550 |
Source: Public Records
Map
Nearby Homes
- 4803 Azalea Place Unit 1
- 4709 Snow White Terrace
- 4715 Richland Woods Ct
- 4832 Bambi Dr
- 5205 Wickway Dr
- 4821 Wick Mor Dr
- 0 Humbert Rd Unit MIS25052876
- 0 Humbert Rd Unit MIS26022914
- 0 Humbert Rd Unit MAR25003159
- 0 Humbert Rd Unit 22441353
- 5667 Humbert Rd
- 4443 Delta Queen Ln
- 400 Saint Rose Dr
- 00 Pine Ridge Lot#52 Dr
- 201 Pine Ridge Dr
- 208 Pine Ridge Dr
- 1814 Muny Vista Ct
- 2628 Jamison Dr
- 2633 Jamison Dr
- 109 Windsor Place
- 2024 Savannah Trace
- 4639 Magnolia Place
- 4640 Camellia Place
- 4638 Camellia Place
- 4637 Magnolia Place
- 4642 Camellia Place
- 2020 Savannah Trace
- 2012 Savannah Trace
- 4636 Camellia Place
- 2018 Savannah Trace
- 2016 Savannah Trace
- 2020 Savannah Trace
- 4638 Magnolia Place
- 4635 Magnolia Place
- 2022 Savannah Trace
- 4634 Camellia Place
- 4634 Camellia
- 2031 Savannah Trace
- 4632 Camellia Place
- 4634 Magnolia Place
Your Personal Tour Guide
Ask me questions while you tour the home.