Estimated Value: $285,323 - $307,000
3
Beds
2
Baths
2,012
Sq Ft
$147/Sq Ft
Est. Value
About This Home
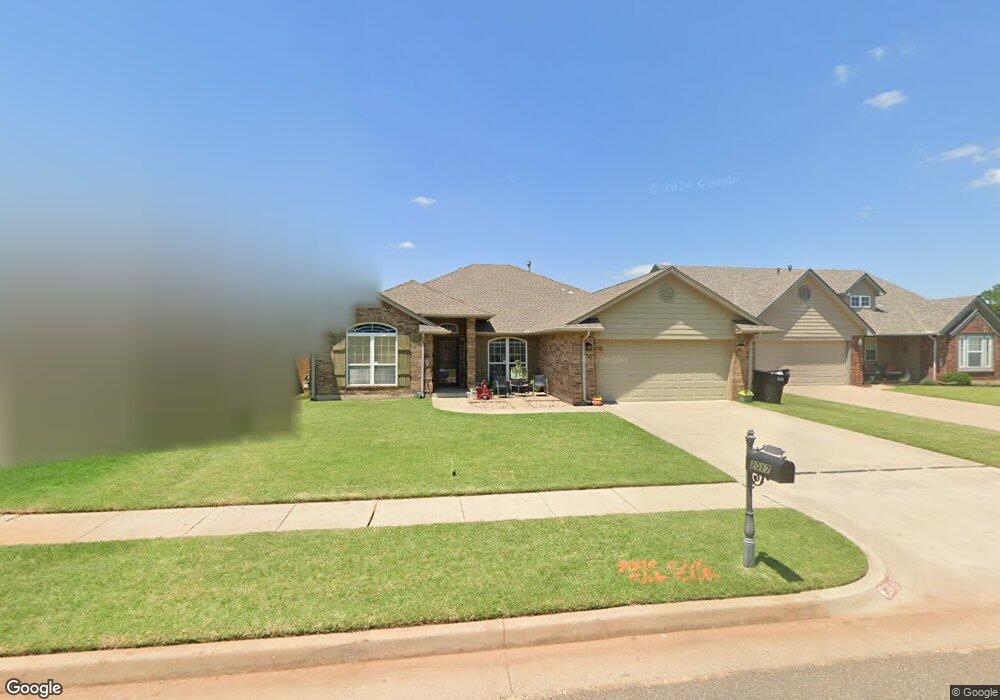
This home is located at 2017 SE 9th St, Moore, OK 73160 and is currently estimated at $296,581, approximately $147 per square foot. 2017 SE 9th St is a home located in Cleveland County with nearby schools including Heritage Trails Elementary School, Highland East Junior High School, and Moore High School.
Ownership History
Date
Name
Owned For
Owner Type
Purchase Details
Closed on
Jun 23, 2006
Sold by
Bridgeport Development Group Llc
Bought by
Fitzgerald John D and Fitzgerald Mary J
Current Estimated Value
Home Financials for this Owner
Home Financials are based on the most recent Mortgage that was taken out on this home.
Original Mortgage
$172,575
Interest Rate
6.47%
Mortgage Type
VA
Purchase Details
Closed on
Sep 26, 2005
Sold by
Methvin Enterprises Inc
Bought by
Bridgeport Development Llc
Create a Home Valuation Report for This Property
The Home Valuation Report is an in-depth analysis detailing your home's value as well as a comparison with similar homes in the area
Home Values in the Area
Average Home Value in this Area
Purchase History
| Date | Buyer | Sale Price | Title Company |
|---|---|---|---|
| Fitzgerald John D | $173,000 | Lawyers Title Of Oklahoma Ci | |
| Bridgeport Development Llc | $250,000 | None Available |
Source: Public Records
Mortgage History
| Date | Status | Borrower | Loan Amount |
|---|---|---|---|
| Previous Owner | Fitzgerald John D | $172,575 |
Source: Public Records
Tax History Compared to Growth
Tax History
| Year | Tax Paid | Tax Assessment Tax Assessment Total Assessment is a certain percentage of the fair market value that is determined by local assessors to be the total taxable value of land and additions on the property. | Land | Improvement |
|---|---|---|---|---|
| 2024 | -- | $25,359 | $4,416 | $20,943 |
| 2023 | $0 | $24,620 | $4,461 | $20,159 |
| 2022 | $0 | $23,903 | $4,437 | $19,466 |
| 2021 | $2,759 | $23,207 | $3,956 | $19,251 |
| 2020 | $2,678 | $22,531 | $3,716 | $18,815 |
| 2019 | $2,643 | $21,875 | $3,000 | $18,875 |
| 2018 | $2,701 | $22,329 | $3,000 | $19,329 |
| 2017 | $2,716 | $22,329 | $0 | $0 |
| 2016 | $2,692 | $21,995 | $2,955 | $19,040 |
| 2015 | $2,361 | $21,355 | $3,106 | $18,249 |
| 2014 | $2,417 | $21,355 | $3,106 | $18,249 |
Source: Public Records
Map
Nearby Homes
- 908 Cottonwood Dr
- 1009 Ashwood Ln
- 705 Cottonwood Dr
- 624 Applewood St
- 1308 Anns Place
- 1712 SE 12th St
- 2100 SE 5th St
- 1104 Silver Maple
- 2433 SE 12th St
- 1105 Spruce Dr
- 401 S Bryant Ave
- 1517 SE 6th St
- 1013 Kelsi Dr
- 1809 Parkway Dr
- 1109 Jacob Dr
- 1336 Brice Dr
- 1126 Jacob Dr
- 1912 SE 18th St
- 2625 SE 8th St
- 2632 SE 7th St
- 2021 SE 9th St
- 2013 SE 9th St
- 2016 Wimberley Creek Dr
- 2101 SE 9th St
- 2012 Wimberley Creek Dr
- 2009 SE 9th St
- 2020 Wimberley Creek Dr
- 910 Renita Way
- 2105 SE 9th St
- 2020 SE 9th St
- 906 Renita Way
- 2016 SE 9th St
- 2012 SE 9th St
- 2100 SE 9th St
- 2008 Wimberley Creek Dr
- 2024 Wimberley Creek Dr
- 2109 SE 9th St
- 2104 SE 9th St
- 921 Renita Way
- 1016 Renita Way