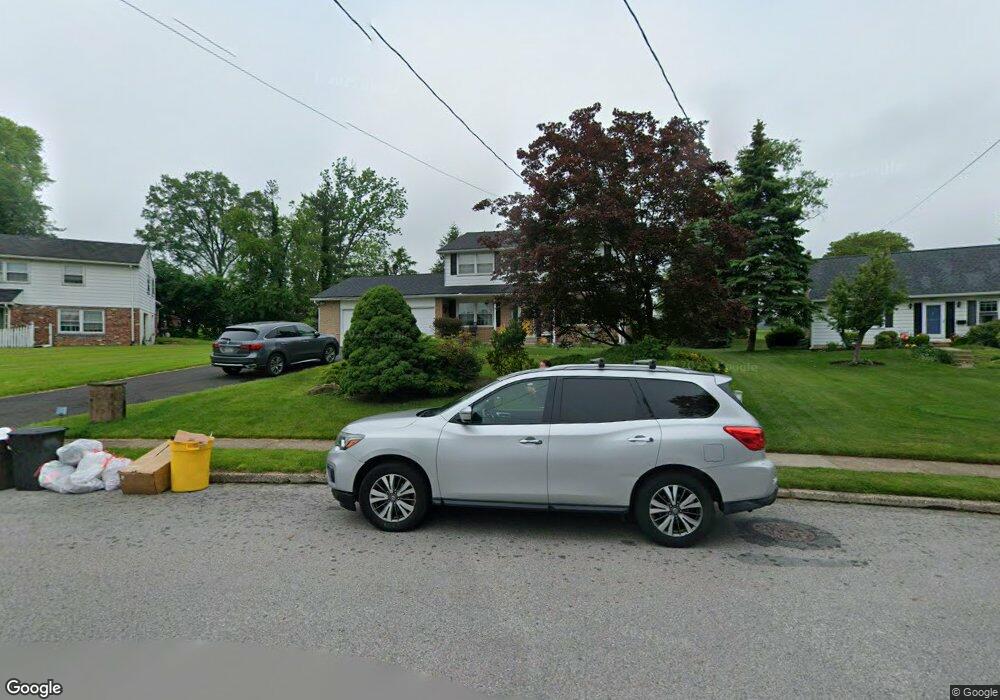
2017 Surrey Rd Oreland, PA 19075
Estimated Value: $571,064 - $639,000
4
Beds
3
Baths
2,048
Sq Ft
$297/Sq Ft
Est. Value
About This Home
This home is located at 2017 Surrey Rd, Oreland, PA 19075 and is currently estimated at $607,766, approximately $296 per square foot. 2017 Surrey Rd is a home located in Montgomery County with nearby schools including Erdenheim Elementary School, Enfield Elementary School, and Springfield Township Middle School.
Ownership History
Date
Name
Owned For
Owner Type
Purchase Details
Closed on
Mar 9, 2005
Sold by
Not Provided
Bought by
Not Provided
Current Estimated Value
Home Financials for this Owner
Home Financials are based on the most recent Mortgage that was taken out on this home.
Original Mortgage
$305,000
Outstanding Balance
$154,934
Interest Rate
5.64%
Mortgage Type
New Conventional
Estimated Equity
$452,832
Purchase Details
Closed on
Mar 1, 2005
Sold by
Not Provided
Bought by
Not Provided
Home Financials for this Owner
Home Financials are based on the most recent Mortgage that was taken out on this home.
Original Mortgage
$305,000
Outstanding Balance
$154,934
Interest Rate
5.64%
Mortgage Type
New Conventional
Estimated Equity
$452,832
Create a Home Valuation Report for This Property
The Home Valuation Report is an in-depth analysis detailing your home's value as well as a comparison with similar homes in the area
Home Values in the Area
Average Home Value in this Area
Purchase History
| Date | Buyer | Sale Price | Title Company |
|---|---|---|---|
| Not Provided | $390,000 | -- | |
| Not Provided | $390,000 | -- |
Source: Public Records
Mortgage History
| Date | Status | Borrower | Loan Amount |
|---|---|---|---|
| Open | Not Provided | $305,000 | |
| Closed | Not Provided | $305,000 |
Source: Public Records
Tax History Compared to Growth
Tax History
| Year | Tax Paid | Tax Assessment Tax Assessment Total Assessment is a certain percentage of the fair market value that is determined by local assessors to be the total taxable value of land and additions on the property. | Land | Improvement |
|---|---|---|---|---|
| 2025 | $7,800 | $165,580 | $47,980 | $117,600 |
| 2024 | $7,800 | $165,580 | $47,980 | $117,600 |
| 2023 | $7,529 | $165,580 | $47,980 | $117,600 |
| 2022 | $7,312 | $165,580 | $47,980 | $117,600 |
| 2021 | $7,121 | $165,580 | $47,980 | $117,600 |
| 2020 | $6,954 | $165,580 | $47,980 | $117,600 |
| 2019 | $6,848 | $165,580 | $47,980 | $117,600 |
| 2018 | $6,848 | $165,580 | $47,980 | $117,600 |
| 2017 | $6,537 | $165,580 | $47,980 | $117,600 |
| 2016 | $6,473 | $165,580 | $47,980 | $117,600 |
| 2015 | $6,152 | $165,580 | $47,980 | $117,600 |
| 2014 | $6,152 | $165,580 | $47,980 | $117,600 |
Source: Public Records
Map
Nearby Homes
- 6326 Farmar Ln
- 1709 Church Rd
- 223 Orlemann Ave
- 312 E Mill Rd
- 2106 Carolton Way
- 300 Lorraine Ave
- 160 Camp Hill Rd
- 238 Plymouth Ave
- 6274 W Valley Green Rd
- 10 Ronald Cir
- 1901 Pennsylvania Ave
- 231 Montgomery Ave
- 442 Oreland Mill Rd
- 500 E Mill Rd
- 1203 Wedgewood Rd
- 522 Pennsylvania Ave
- 200 Redford Rd
- Redford Plan at The Towns at Pennybrook
- 611 Creek Ln
- 407 Pennybrook Ct Unit 4 REDFORD END