Estimated Value: $385,381 - $472,000
2
Beds
2
Baths
1,574
Sq Ft
$266/Sq Ft
Est. Value
About This Home
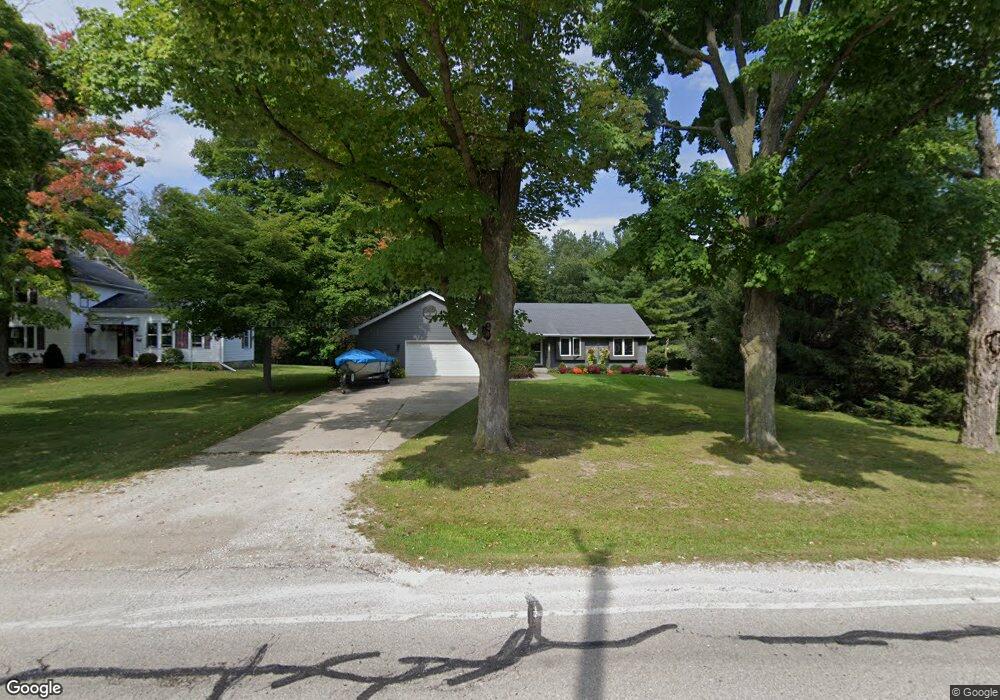
This home is located at 2018 116th St, Pleasant Prairie, WI 53158 and is currently estimated at $418,595, approximately $265 per square foot. 2018 116th St is a home located in Kenosha County with nearby schools including Prairie Lane Elementary School, Lincoln Middle School, and Tremper High School.
Ownership History
Date
Name
Owned For
Owner Type
Purchase Details
Closed on
Sep 22, 2016
Sold by
Traynor William Jacob and Traynor Marjory May
Bought by
Traynor Joint Trust
Current Estimated Value
Home Financials for this Owner
Home Financials are based on the most recent Mortgage that was taken out on this home.
Original Mortgage
$230,800
Outstanding Balance
$184,354
Interest Rate
3.43%
Mortgage Type
New Conventional
Estimated Equity
$234,241
Purchase Details
Closed on
Sep 19, 2016
Sold by
The William Jacob Traynor Jt
Bought by
Traynor William J
Home Financials for this Owner
Home Financials are based on the most recent Mortgage that was taken out on this home.
Original Mortgage
$230,800
Outstanding Balance
$184,354
Interest Rate
3.43%
Mortgage Type
New Conventional
Estimated Equity
$234,241
Purchase Details
Closed on
Jul 6, 2012
Sold by
Traynor William J and Traynor Marjory M
Bought by
Traynor William Jacob and Traynor Marjory May
Purchase Details
Closed on
Jul 17, 2006
Sold by
Bloss Robert J and Bloss Doreen S
Bought by
Traynor William J and Traynor Marjory M
Create a Home Valuation Report for This Property
The Home Valuation Report is an in-depth analysis detailing your home's value as well as a comparison with similar homes in the area
Home Values in the Area
Average Home Value in this Area
Purchase History
| Date | Buyer | Sale Price | Title Company |
|---|---|---|---|
| Traynor Joint Trust | -- | -- | |
| Traynor William J | -- | -- | |
| Traynor William Jacob | -- | None Available | |
| Traynor William J | $258,900 | None Available |
Source: Public Records
Mortgage History
| Date | Status | Borrower | Loan Amount |
|---|---|---|---|
| Open | Traynor William J | $230,800 |
Source: Public Records
Tax History Compared to Growth
Tax History
| Year | Tax Paid | Tax Assessment Tax Assessment Total Assessment is a certain percentage of the fair market value that is determined by local assessors to be the total taxable value of land and additions on the property. | Land | Improvement |
|---|---|---|---|---|
| 2024 | $3,851 | $341,800 | $68,100 | $273,700 |
| 2023 | $3,656 | $285,100 | $62,100 | $223,000 |
| 2022 | $3,728 | $285,100 | $62,100 | $223,000 |
| 2021 | $3,745 | $209,000 | $49,200 | $159,800 |
| 2020 | $3,838 | $209,000 | $49,200 | $159,800 |
| 2019 | $3,511 | $209,000 | $49,200 | $159,800 |
| 2018 | $3,586 | $209,000 | $49,200 | $159,800 |
| 2017 | $3,876 | $179,600 | $44,700 | $134,900 |
| 2016 | $3,827 | $179,600 | $44,700 | $134,900 |
| 2015 | $3,232 | $164,400 | $41,300 | $123,100 |
| 2014 | $3,367 | $164,400 | $41,300 | $123,100 |
Source: Public Records
Map
Nearby Homes