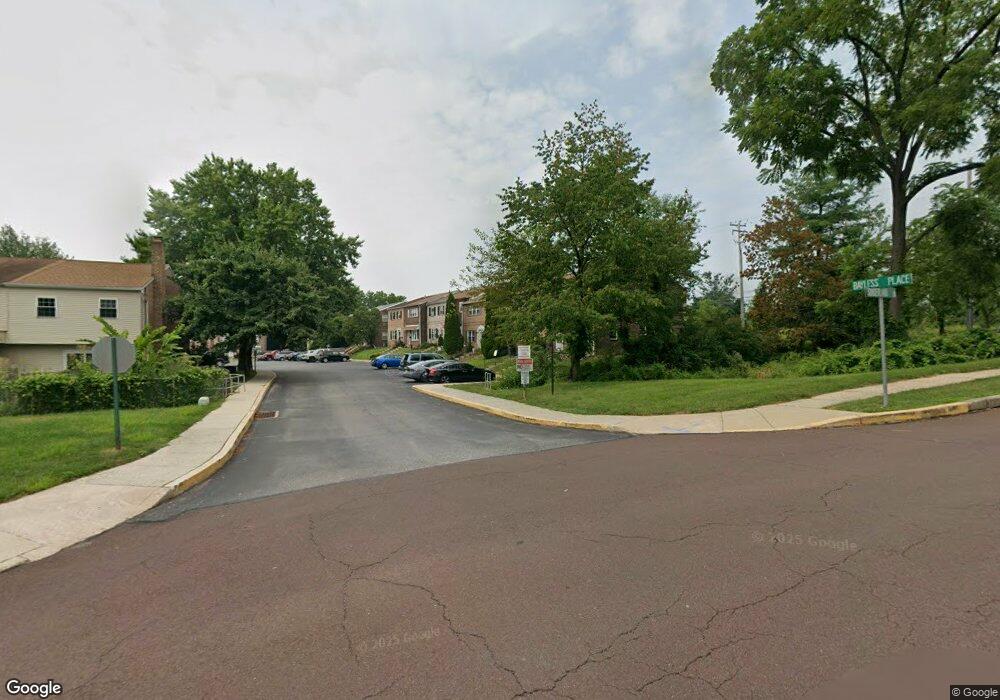
2018 Bayless Place Unit Q5 Norristown, PA 19403
Estimated Value: $284,000 - $325,000
2
Beds
3
Baths
1,260
Sq Ft
$246/Sq Ft
Est. Value
About This Home
This home is located at 2018 Bayless Place Unit Q5, Norristown, PA 19403 and is currently estimated at $309,520, approximately $245 per square foot. 2018 Bayless Place Unit Q5 is a home located in Montgomery County with nearby schools including Skyview Upper Elementary School, Eagleville Elementary School, and Arcola Intermediate School.
Ownership History
Date
Name
Owned For
Owner Type
Purchase Details
Closed on
Apr 29, 2010
Sold by
Didonato Kimberly L
Bought by
Gomezrueda Carlos and Gomezrueda Ivonne
Current Estimated Value
Home Financials for this Owner
Home Financials are based on the most recent Mortgage that was taken out on this home.
Original Mortgage
$169,866
Outstanding Balance
$114,964
Interest Rate
5.25%
Mortgage Type
FHA
Estimated Equity
$194,556
Purchase Details
Closed on
Feb 20, 2007
Sold by
Didonato Kimberly and Didonato Vincent
Bought by
Didonato Kimberly L
Purchase Details
Closed on
Dec 22, 2003
Sold by
Messina Metrus F and Messina Joan
Bought by
Didonato Vincent J and Didonato Kimberly L
Home Financials for this Owner
Home Financials are based on the most recent Mortgage that was taken out on this home.
Original Mortgage
$92,000
Interest Rate
5.86%
Create a Home Valuation Report for This Property
The Home Valuation Report is an in-depth analysis detailing your home's value as well as a comparison with similar homes in the area
Home Values in the Area
Average Home Value in this Area
Purchase History
| Date | Buyer | Sale Price | Title Company |
|---|---|---|---|
| Gomezrueda Carlos | $173,000 | None Available | |
| Didonato Kimberly L | -- | None Available | |
| Didonato Vincent J | $115,000 | -- |
Source: Public Records
Mortgage History
| Date | Status | Borrower | Loan Amount |
|---|---|---|---|
| Open | Gomezrueda Carlos | $169,866 | |
| Previous Owner | Didonato Vincent J | $92,000 |
Source: Public Records
Tax History Compared to Growth
Tax History
| Year | Tax Paid | Tax Assessment Tax Assessment Total Assessment is a certain percentage of the fair market value that is determined by local assessors to be the total taxable value of land and additions on the property. | Land | Improvement |
|---|---|---|---|---|
| 2025 | $3,449 | $84,580 | $14,440 | $70,140 |
| 2024 | $3,449 | $84,580 | $14,440 | $70,140 |
| 2023 | $3,318 | $84,580 | $14,440 | $70,140 |
| 2022 | $3,228 | $84,580 | $14,440 | $70,140 |
| 2021 | $3,145 | $84,580 | $14,440 | $70,140 |
| 2020 | $3,071 | $84,580 | $14,440 | $70,140 |
| 2019 | $3,043 | $84,580 | $14,440 | $70,140 |
| 2018 | $3,044 | $84,580 | $14,440 | $70,140 |
| 2017 | $2,906 | $84,580 | $14,440 | $70,140 |
| 2016 | $2,873 | $84,580 | $14,440 | $70,140 |
| 2015 | $2,762 | $84,580 | $14,440 | $70,140 |
| 2014 | $2,762 | $84,580 | $14,440 | $70,140 |
Source: Public Records
Map
Nearby Homes
- 2016 Bayless Place Unit CONDO Q-4
- 3001 Cardin Place Unit R1
- 1070 Bayless Place Unit F3
- 4069 Cardin Place Unit CONDO DD-3
- 11 Pershing Ave
- 12 Wilson Blvd
- 11 Wilson Blvd
- 636 Hillside Ave
- 38 S Grange Ave
- 115 Sunnyside Ave
- 1102 Redtail Rd
- 3026 Highley Rd
- 44 N Barry Ave
- 63 Smith Rd
- 4021 Killington Ct
- 109 N Park Ave
- 520 Deerfield Dr
- 2108 Peregrine Cir
- 24 Wayne Ave
- 3334 Germantown Pike
- 2020 Bayless Place Unit Q6
- 2016 Bayless Place Unit Q4
- 2022 Bayless Place Unit Q7
- 2014 Bayless Place Unit Q3
- 2012 Bayless Place Unit Q2
- 2024 Bayless Place Unit Q8
- 2010 Bayless Place Unit Q1
- 2008 Bayless Place Unit P8
- 2008 Bayless Place Unit CONDO P-8
- 2040 Bayless Place Unit L1
- 2006 Bayless Place Unit P7
- 2038 Bayless Place Unit L2
- 2004 Bayless Place Unit P6
- 2036 Bayless Place Unit L3
- 2002 Bayless Place Unit P5
- 2034 Bayless Place Unit L4
- 1192 Bayless Place Unit M1
- 2000 Bayless Place Unit P4
- 1190 Bayless Place Unit M2
- 2032 Bayless Place Unit L5