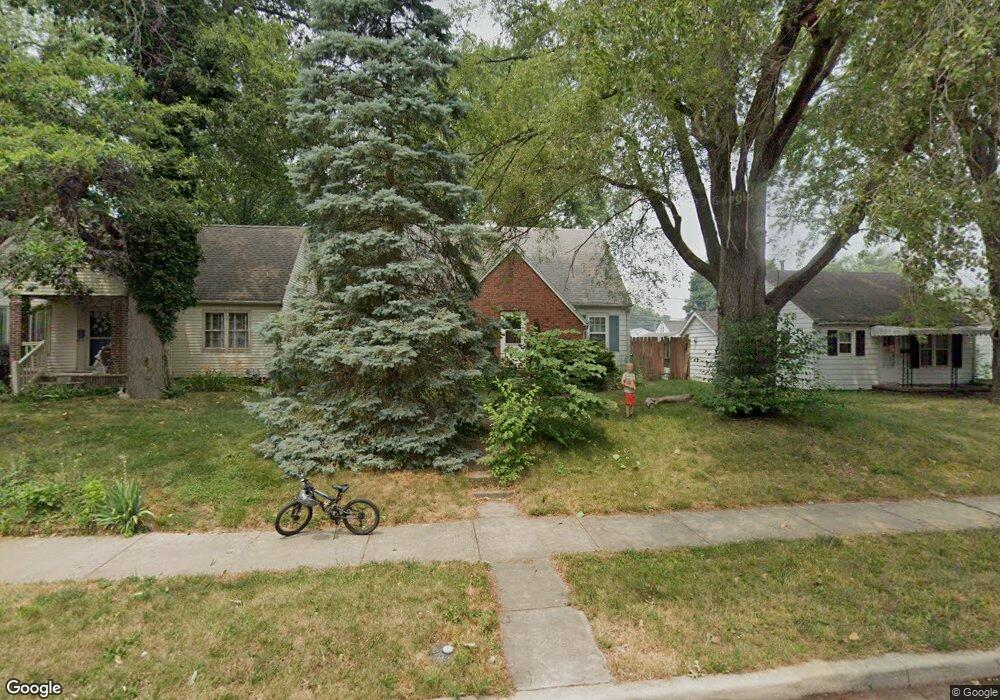
2018 Charles St Lafayette, IN 47904
Saint Lawrence McAllister NeighborhoodEstimated Value: $145,000 - $190,000
3
Beds
1
Bath
840
Sq Ft
$210/Sq Ft
Est. Value
About This Home
This home is located at 2018 Charles St, Lafayette, IN 47904 and is currently estimated at $176,358, approximately $209 per square foot. 2018 Charles St is a home located in Tippecanoe County with nearby schools including Vinton Elementary School, Sunnyside Intermediate School, and Lafayette Tecumseh Junior High School.
Ownership History
Date
Name
Owned For
Owner Type
Purchase Details
Closed on
Sep 7, 2011
Sold by
Stichter Sara Kay
Bought by
Stichter Sara Kay and Gouvan Sherry Kay
Current Estimated Value
Purchase Details
Closed on
Mar 20, 2009
Sold by
Fleming Jeffrey M and Fleming Carla D
Bought by
Stichter Sara Kay
Home Financials for this Owner
Home Financials are based on the most recent Mortgage that was taken out on this home.
Original Mortgage
$51,425
Outstanding Balance
$32,560
Interest Rate
5.05%
Mortgage Type
New Conventional
Estimated Equity
$143,798
Purchase Details
Closed on
Jan 31, 2007
Sold by
Obrien Trent W and Obrien April D
Bought by
Fleming Jeffrey M and Fleming Carla D
Home Financials for this Owner
Home Financials are based on the most recent Mortgage that was taken out on this home.
Original Mortgage
$83,000
Interest Rate
6.19%
Mortgage Type
Purchase Money Mortgage
Create a Home Valuation Report for This Property
The Home Valuation Report is an in-depth analysis detailing your home's value as well as a comparison with similar homes in the area
Home Values in the Area
Average Home Value in this Area
Purchase History
| Date | Buyer | Sale Price | Title Company |
|---|---|---|---|
| Stichter Sara Kay | -- | Metropolitan Title | |
| Stichter Sara Kay | -- | None Available | |
| Fleming Jeffrey M | -- | None Available |
Source: Public Records
Mortgage History
| Date | Status | Borrower | Loan Amount |
|---|---|---|---|
| Open | Stichter Sara Kay | $51,425 | |
| Previous Owner | Fleming Jeffrey M | $83,000 |
Source: Public Records
Tax History Compared to Growth
Tax History
| Year | Tax Paid | Tax Assessment Tax Assessment Total Assessment is a certain percentage of the fair market value that is determined by local assessors to be the total taxable value of land and additions on the property. | Land | Improvement |
|---|---|---|---|---|
| 2024 | $838 | $113,000 | $13,000 | $100,000 |
| 2023 | $744 | $106,000 | $13,000 | $93,000 |
| 2022 | $693 | $90,800 | $13,000 | $77,800 |
| 2021 | $485 | $76,100 | $13,000 | $63,100 |
| 2020 | $411 | $67,700 | $13,000 | $54,700 |
| 2019 | $381 | $63,300 | $11,000 | $52,300 |
| 2018 | $364 | $60,300 | $11,000 | $49,300 |
| 2017 | $356 | $59,800 | $11,000 | $48,800 |
| 2016 | $333 | $57,400 | $11,000 | $46,400 |
| 2014 | $322 | $56,500 | $11,000 | $45,500 |
| 2013 | $322 | $57,400 | $11,000 | $46,400 |
Source: Public Records
Map
Nearby Homes
- 2022 Elk St
- 2127 Perrine St
- 2340 N 20th St
- 2211 N 24th St
- 1925 Maple St
- 1904 Greenbush St
- 1829 Greenbush St
- 108 Barbee St
- 1931 Morton St
- 2101 Monon Ave
- 2645 Midlex Ct
- 2024 Stillwell St
- 1803 Pierce St
- 2209 Monon Ave
- 2901 Elk St
- 1411 N 14th St
- 3000 Underwood St
- 2154 Ulen Ln
- 3013 Darby Ln
- 1039 Tulip Ln
- 2014 Charles St
- 2022 Charles St
- 2026 Charles St
- 2030 Charles St
- 2017 Underwood St
- 2015 Underwood St
- 2021 Underwood St
- 2011 Underwood St
- 2025 Underwood St
- 2000 Charles St
- 2019 Charles St
- 2015 Charles St
- 2023 Charles St
- 2007 Underwood St
- 2029 Underwood St
- 2005 Charles St
- 2025 Charles St
- 2102 Charles St
- 2001 Underwood St
- 2001 Charles St