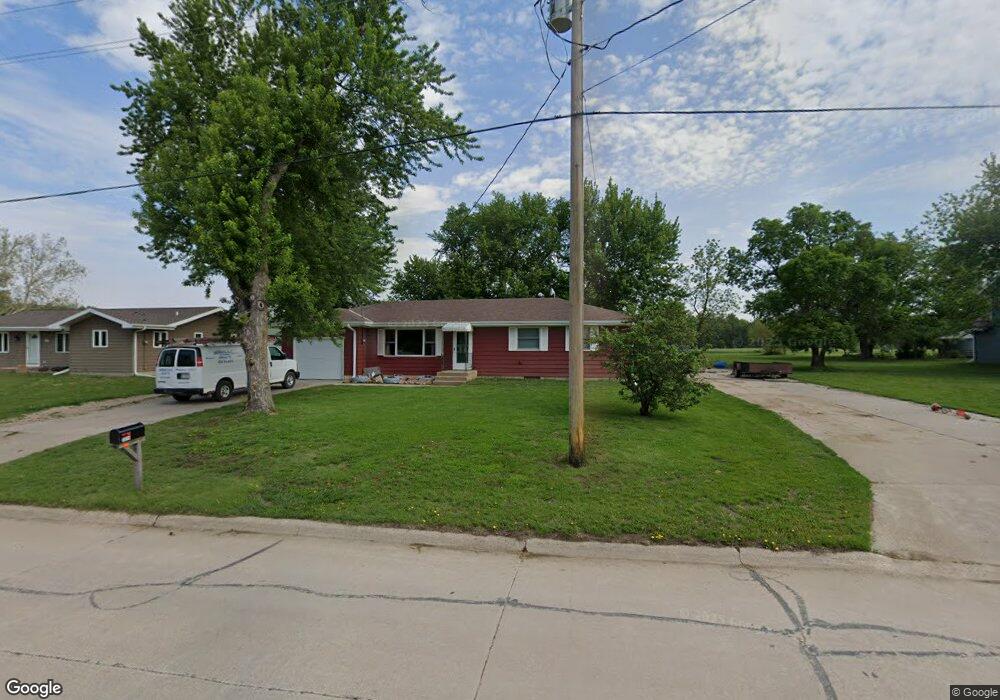
2018 Dimery Ave Beaver Crossing, NE 68313
Estimated Value: $188,000 - $212,845
3
Beds
2
Baths
1,144
Sq Ft
$179/Sq Ft
Est. Value
About This Home
This home is located at 2018 Dimery Ave, Beaver Crossing, NE 68313 and is currently estimated at $204,711, approximately $178 per square foot. 2018 Dimery Ave is a home located in Seward County with nearby schools including Centennial Elementary School and Centennial High School.
Ownership History
Date
Name
Owned For
Owner Type
Purchase Details
Closed on
Feb 28, 2020
Sold by
Quisling Emily Elizabeth
Bought by
Quisling Scott Alan
Current Estimated Value
Purchase Details
Closed on
Sep 27, 2007
Sold by
Smith Mary J
Bought by
Burkey Peter L and Burkey Anita J
Home Financials for this Owner
Home Financials are based on the most recent Mortgage that was taken out on this home.
Original Mortgage
$63,000
Interest Rate
6.47%
Mortgage Type
New Conventional
Create a Home Valuation Report for This Property
The Home Valuation Report is an in-depth analysis detailing your home's value as well as a comparison with similar homes in the area
Home Values in the Area
Average Home Value in this Area
Purchase History
| Date | Buyer | Sale Price | Title Company |
|---|---|---|---|
| Quisling Scott Alan | -- | None Listed On Document | |
| Burkey Peter L | $83,000 | -- |
Source: Public Records
Mortgage History
| Date | Status | Borrower | Loan Amount |
|---|---|---|---|
| Previous Owner | Burkey Peter L | $63,000 |
Source: Public Records
Tax History Compared to Growth
Tax History
| Year | Tax Paid | Tax Assessment Tax Assessment Total Assessment is a certain percentage of the fair market value that is determined by local assessors to be the total taxable value of land and additions on the property. | Land | Improvement |
|---|---|---|---|---|
| 2024 | $1,595 | $153,246 | $6,300 | $146,946 |
| 2023 | $2,001 | $153,246 | $6,300 | $146,946 |
| 2022 | $1,780 | $125,257 | $6,300 | $118,957 |
| 2021 | $1,645 | $118,785 | $6,300 | $112,485 |
| 2020 | $1,417 | $103,644 | $6,300 | $97,344 |
| 2019 | $1,388 | $103,644 | $6,300 | $97,344 |
| 2018 | $1,374 | $103,644 | $6,300 | $97,344 |
| 2017 | $1,262 | $91,056 | $5,880 | $85,176 |
| 2016 | $1,170 | $91,056 | $5,880 | $85,176 |
| 2015 | $1,001 | $77,426 | $5,625 | $71,801 |
| 2013 | $1,186 | $81,035 | $5,625 | $75,410 |
Source: Public Records
Map
Nearby Homes
- 735 Dimery Ave
- 703 420th
- 315 392nd Unit LotWP001
- 315 392nd
- 230 Montana Cir
- 141 Bronco Cir
- 130 Maple St
- 310 S Chestnut St
- 403 S Chestnut St
- 414 Spring St
- 419 S Chestnut St
- 514 5th St
- 1003 5th St
- 410 B St
- 715 S Chestnut St
- 618 Timberline Cir
- 614 Timberline Cir
- 0 Oak Ave
- 0 Tbd 294 Rd Unit 11552208
- 405 Cottonwood Ave
- 2012 Dimery Ave
- 2020 Dimery Ave
- 2028 Dimery Ave
- 2028 Dimery St
- 2008 Dimery Ave
- 2019 Dimery Ave
- 2027 Dimery Ave
- 2015 Dimery Ave
- 2031 Dimery Ave
- 649 406th
- 649 406th
- 0 Holdrege & 434th Rd Unit 10064130
- 4800 S 392 Rd
- 0 County Rd Unit L10070830
- 601 Albert St
- 602 Albert St
- 801 Miller St
- 655 406th
- 1030 Dimery Ave
- 1026 Dimery Ave