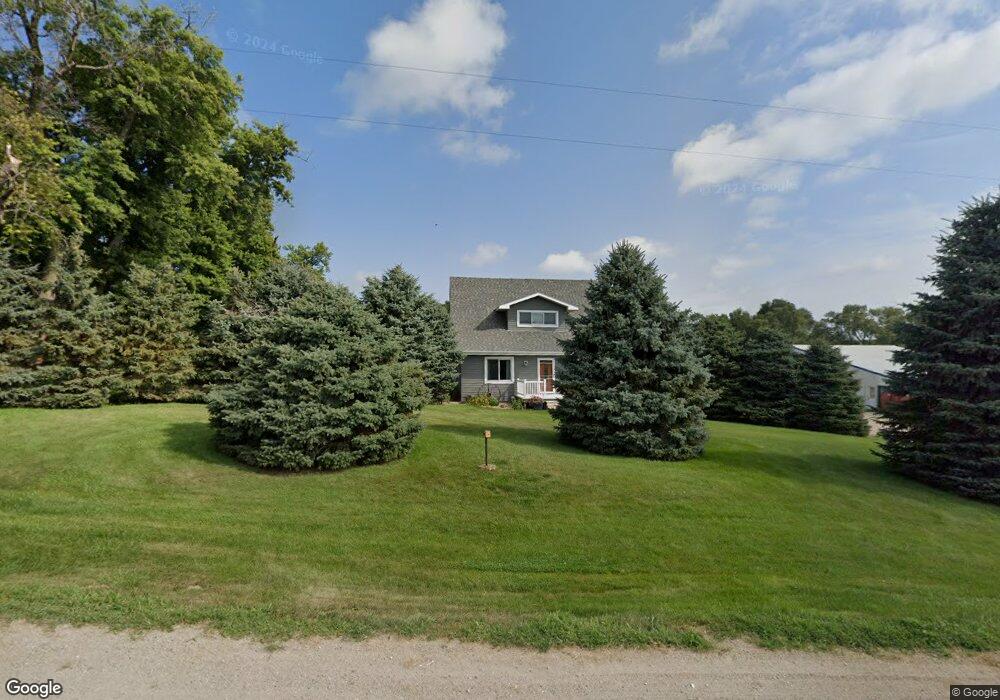
2018 F Rd West Point, NE 68788
Estimated Value: $488,000 - $1,620,000
4
Beds
2
Baths
2,871
Sq Ft
$353/Sq Ft
Est. Value
About This Home
This home is located at 2018 F Rd, West Point, NE 68788 and is currently estimated at $1,012,469, approximately $352 per square foot. 2018 F Rd is a home located in Cuming County with nearby schools including West Point-Beemer Junior/Senior High School and St. Paul Lutheran School.
Ownership History
Date
Name
Owned For
Owner Type
Purchase Details
Closed on
May 8, 2020
Sold by
Meyer Dale L and The Loala F Meyer Revocable Tr
Bought by
Wooldrik Craig E and Wooldrik Wendy L
Current Estimated Value
Home Financials for this Owner
Home Financials are based on the most recent Mortgage that was taken out on this home.
Original Mortgage
$1,322,000
Outstanding Balance
$1,170,820
Interest Rate
3.5%
Mortgage Type
Commercial
Estimated Equity
-$158,351
Create a Home Valuation Report for This Property
The Home Valuation Report is an in-depth analysis detailing your home's value as well as a comparison with similar homes in the area
Home Values in the Area
Average Home Value in this Area
Purchase History
| Date | Buyer | Sale Price | Title Company |
|---|---|---|---|
| Wooldrik Craig E | $1,086,750 | None Available |
Source: Public Records
Mortgage History
| Date | Status | Borrower | Loan Amount |
|---|---|---|---|
| Open | Wooldrik Craig E | $1,322,000 |
Source: Public Records
Tax History Compared to Growth
Tax History
| Year | Tax Paid | Tax Assessment Tax Assessment Total Assessment is a certain percentage of the fair market value that is determined by local assessors to be the total taxable value of land and additions on the property. | Land | Improvement |
|---|---|---|---|---|
| 2025 | $5,430 | $1,051,765 | $612,440 | $439,325 |
| 2024 | $5,430 | $904,595 | $531,765 | $372,830 |
| 2023 | $7,610 | $848,345 | $476,805 | $371,540 |
| 2022 | $7,630 | $777,290 | $459,260 | $318,030 |
| 2021 | $7,505 | $756,835 | $466,550 | $290,285 |
| 2020 | $7,554 | $773,230 | $504,660 | $268,570 |
| 2019 | $7,364 | $737,810 | $501,880 | $235,930 |
| 2018 | $7,586 | $767,965 | $523,725 | $244,240 |
| 2017 | $7,188 | $703,920 | $471,130 | $232,790 |
| 2016 | $7,028 | $656,915 | $439,565 | $217,350 |
| 2015 | $7,043 | $603,880 | $402,910 | $200,970 |
| 2014 | $6,148 | $529,795 | $339,925 | $189,870 |
| 2013 | $6,148 | $450,595 | $246,835 | $203,760 |
Source: Public Records
Map
Nearby Homes
- 1045 E Grove St
- 126 E Grove St
- 749 E Grove St
- 626 S Monitor St
- 420 S Farragut St
- 519 S Niphon St
- 1402 E Bridge St
- 205 E Sheridan St
- 301 W Pine St
- 208 N Lincoln St
- 101 S Main St
- 402 W Pine St
- 2416 F Rd
- 1207 N Main St
- 2235 K Rd
- 1225 Co Road 1
- TBD Oakland
- 328 N Oakland Ave
- 108 N Thomas Ave
- 206 N Thomas Ave