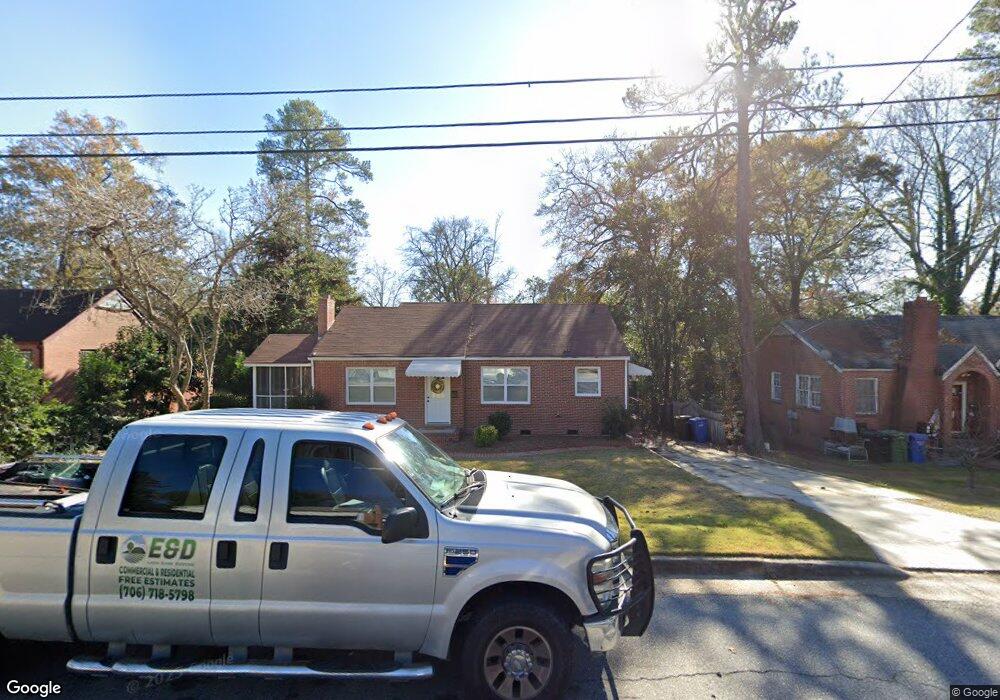
2018 Paris Dr Columbus, GA 31906
East Wynnton-Wynnton Hill NeighborhoodEstimated Value: $50,000 - $136,000
About This Home
For Rent: Newly Renovated Home in Columbus, GA – $1,400/month
Welcome to your dream cottage at 2018 Paris Dr., Columbus, GA 31906! This beautifully renovated home offers modern living in a peaceful neighborhood.
Key Features:
Stylish Interiors: Enjoy cooking in a modern kitchen featuring stainless steel appliances and stunning quartz countertops.
Spacious Outdoor Areas: With a large front and back yard, there’s plenty of space for outdoor activities, gardening, or simply relaxing in the sun.
Comfort Year-Round: Stay comfortable with central heat and air conditioning, perfect for any season.
Energy Efficiency: Newly installed energy-efficient windows and doors help keep utility costs down.
Don’t miss out on this fantastic opportunity! Contact us today to schedule a viewing and make this beautiful house your new home. NO PETS, NO EVICTIONS
Ownership History
Purchase Details
Home Financials for this Owner
Home Financials are based on the most recent Mortgage that was taken out on this home.Home Values in the Area
Average Home Value in this Area
Purchase History
| Date | Buyer | Sale Price | Title Company |
|---|---|---|---|
| Payne Property Rentals Llc | $42,000 | None Listed On Document |
Mortgage History
| Date | Status | Borrower | Loan Amount |
|---|---|---|---|
| Closed | Payne Property Rentals Llc | $81,000 |
Property History
| Date | Event | Price | List to Sale | Price per Sq Ft |
|---|---|---|---|---|
| 11/09/2024 11/09/24 | Off Market | $1,400 | -- | -- |
| 10/08/2024 10/08/24 | Off Market | $1,400 | -- | -- |
| 10/07/2024 10/07/24 | For Rent | $1,400 | 0.0% | -- |
| 10/02/2024 10/02/24 | For Rent | $1,400 | -- | -- |
Tax History Compared to Growth
Tax History
| Year | Tax Paid | Tax Assessment Tax Assessment Total Assessment is a certain percentage of the fair market value that is determined by local assessors to be the total taxable value of land and additions on the property. | Land | Improvement |
|---|---|---|---|---|
| 2025 | $952 | $24,328 | $4,476 | $19,852 |
| 2024 | $952 | $24,328 | $4,476 | $19,852 |
| 2023 | $1,234 | $31,328 | $4,476 | $26,852 |
| 2022 | $1,077 | $26,380 | $4,476 | $21,904 |
| 2021 | $1,043 | $25,556 | $4,476 | $21,080 |
| 2020 | $1,044 | $25,556 | $4,476 | $21,080 |
| 2019 | $1,047 | $25,556 | $4,476 | $21,080 |
| 2018 | $1,047 | $25,556 | $4,476 | $21,080 |
| 2017 | $1,050 | $25,556 | $4,476 | $21,080 |
| 2016 | $909 | $22,034 | $2,739 | $19,295 |
| 2015 | $364 | $22,034 | $2,739 | $19,295 |
| 2014 | $364 | $22,034 | $2,739 | $19,295 |
| 2013 | -- | $22,034 | $2,739 | $19,295 |