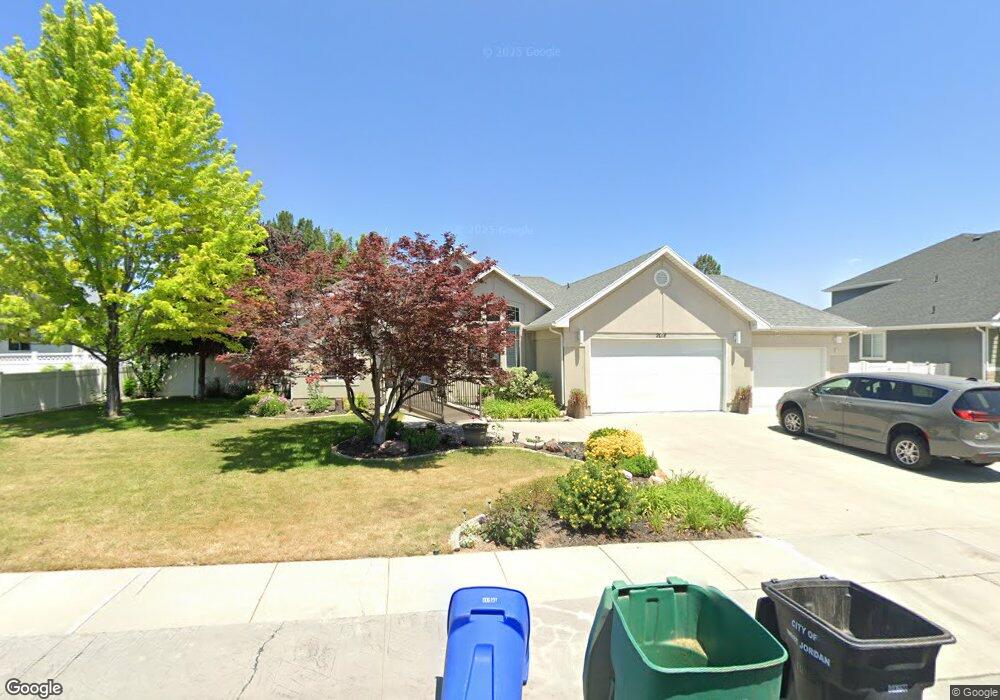
2018 W 8970 S West Jordan, UT 84088
Estimated Value: $746,000 - $799,000
4
Beds
3
Baths
4,000
Sq Ft
$193/Sq Ft
Est. Value
About This Home
This home is located at 2018 W 8970 S, West Jordan, UT 84088 and is currently estimated at $771,604, approximately $192 per square foot. 2018 W 8970 S is a home located in Salt Lake County with nearby schools including Westvale Elementary School, West Jordan Middle School, and West Jordan High School.
Ownership History
Date
Name
Owned For
Owner Type
Purchase Details
Closed on
Nov 22, 2024
Sold by
Cartwright Carole Lynette
Bought by
Cartwright Family Trust and Cartwright
Current Estimated Value
Purchase Details
Closed on
Jul 5, 2024
Sold by
Nancy Pollick Living Trust and Pollick Nancy B
Bought by
Cartwright Carole Lynette
Purchase Details
Closed on
Oct 19, 2022
Sold by
Pollick Nancy B
Bought by
Nancy Pollick Living Trust
Purchase Details
Closed on
Jul 27, 2000
Sold by
Debry Larry S
Bought by
Pollick John R and Pollick Nancy B
Purchase Details
Closed on
Jul 26, 1995
Sold by
K B Builders Inc
Bought by
Debry Larry S
Home Financials for this Owner
Home Financials are based on the most recent Mortgage that was taken out on this home.
Original Mortgage
$33,600
Interest Rate
7.62%
Create a Home Valuation Report for This Property
The Home Valuation Report is an in-depth analysis detailing your home's value as well as a comparison with similar homes in the area
Home Values in the Area
Average Home Value in this Area
Purchase History
| Date | Buyer | Sale Price | Title Company |
|---|---|---|---|
| Cartwright Family Trust | -- | None Listed On Document | |
| Cartwright Family Trust | -- | None Listed On Document | |
| Cartwright Carole Lynette | -- | Inwest Title Services | |
| Nancy Pollick Living Trust | -- | -- | |
| Pollick John R | -- | Equity Title | |
| Debry Larry S | -- | -- | |
| K B Builders Inc | -- | -- |
Source: Public Records
Mortgage History
| Date | Status | Borrower | Loan Amount |
|---|---|---|---|
| Previous Owner | Debry Larry S | $33,600 |
Source: Public Records
Tax History Compared to Growth
Tax History
| Year | Tax Paid | Tax Assessment Tax Assessment Total Assessment is a certain percentage of the fair market value that is determined by local assessors to be the total taxable value of land and additions on the property. | Land | Improvement |
|---|---|---|---|---|
| 2025 | -- | $717,400 | $191,900 | $525,500 |
| 2024 | -- | $633,200 | $177,000 | $456,200 |
| 2023 | $3,349 | $607,300 | $167,000 | $440,300 |
| 2022 | $3,459 | $617,000 | $163,700 | $453,300 |
| 2021 | $2,937 | $477,000 | $132,000 | $345,000 |
| 2020 | $2,774 | $422,800 | $132,000 | $290,800 |
| 2019 | $2,745 | $410,300 | $132,000 | $278,300 |
| 2018 | $0 | $385,600 | $96,800 | $288,800 |
| 2017 | $2,429 | $358,500 | $96,800 | $261,700 |
| 2016 | $2,267 | $314,300 | $92,000 | $222,300 |
| 2015 | $2,155 | $291,400 | $96,300 | $195,100 |
| 2014 | $2,006 | $267,000 | $89,300 | $177,700 |
Source: Public Records
Map
Nearby Homes
- 2041 W 8820 S
- 8859 S Long Dr
- 1773 W 8760 S
- 2223 W Williamsburg Cir
- 2286 Williamsburg Cir
- 9252 S 2040 W Unit D
- 1968 W 9270 S Unit C
- 2177 W 9240 S
- 2116 W Abbey View Rd
- 1633 W Rockaway Ln
- 2097 Jordan Villa Dr
- 8534 S Redwood Rd
- 9414 S 1980 W
- 8518 S Redwood Rd
- 8510 S Redwood Rd
- 9178 Lisa Ave
- 2636 W 9110 S
- 1424 Stone Meadow Dr
- 1753 Rylie Ann Cir
- 1401 W Stone Meadow Dr
- 1998 W 8970 S
- 2021 Garden Crest Cir
- 2021 W Garden Crest Cir
- 2011 W 8970 S
- 2039 Garden Crest Cir
- 2039 Garden Crest Cir Unit 110
- 2031 W 8970 S
- 2058 W 8970 S
- 1996 W 8970 Dr S
- 1993 W 8970 S
- 8947 S 2070 W
- 8942 S Okubo Dr
- 2012 W Garden Crest Cir
- 2012 Garden Crest Cir
- 8961 S 2070 W
- 2059 W 8970 S
- 8926 S Okubo Dr
- 1991 W 8970 S
- 8933 S 2070 W
- 8908 S Okubo Dr