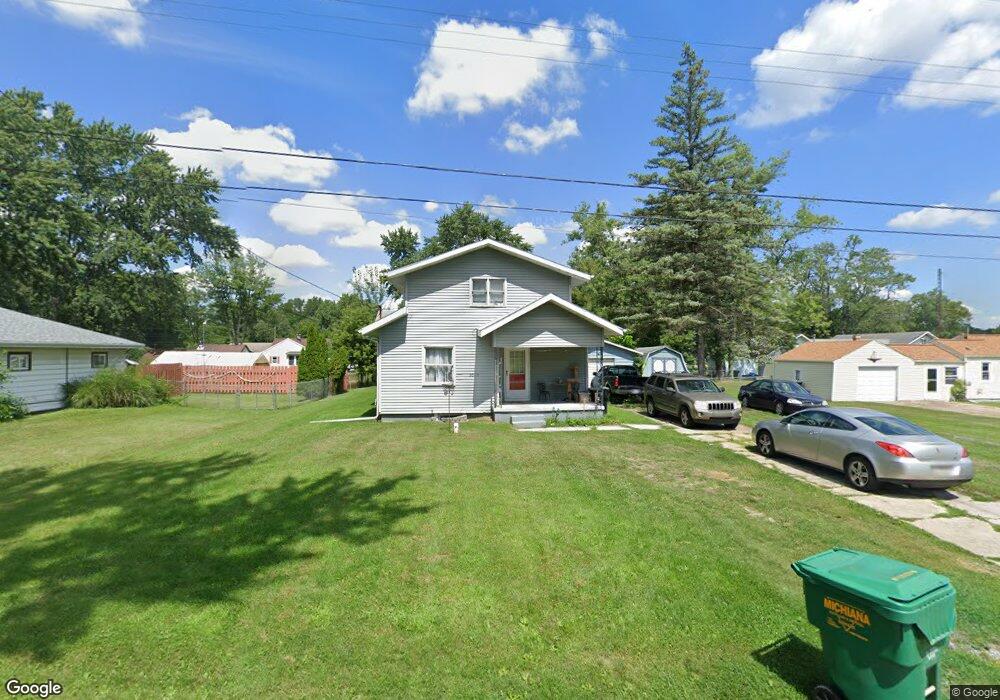
20185 Pulling St South Bend, IN 46614
Estimated Value: $63,000 - $196,000
3
Beds
1
Bath
1,527
Sq Ft
$105/Sq Ft
Est. Value
About This Home
This home is located at 20185 Pulling St, South Bend, IN 46614 and is currently estimated at $160,325, approximately $104 per square foot. 20185 Pulling St is a home located in St. Joseph County with nearby schools including Hay Elementary School, Marshall Traditional School, and Clay Intermediate Center.
Ownership History
Date
Name
Owned For
Owner Type
Purchase Details
Closed on
May 7, 2025
Sold by
Steven H And Judith L Overmyer Revocable and Steve And Judy Overmyer Revocable Living
Bought by
Hall Jeff
Current Estimated Value
Purchase Details
Closed on
Feb 24, 2015
Sold by
Horvath Tomeka and Horvath Leslie Stephen
Bought by
Overmyer Trust
Purchase Details
Closed on
Mar 4, 2013
Sold by
Overmyer Steve
Bought by
Horvath Tomeka and Horvath Leslie
Purchase Details
Closed on
Apr 30, 2012
Sold by
Reverse Mortgage Solutions
Bought by
Overmyer Steve H and Overmyer Judith L
Purchase Details
Closed on
Sep 24, 2010
Sold by
Alliance Financial Corporation
Bought by
Reverse Mortgage Solutions and Bank Of America
Purchase Details
Closed on
Mar 25, 2010
Sold by
Roper James Michael
Bought by
World Alliance Financial Corp
Purchase Details
Closed on
Mar 5, 2007
Sold by
Myers Ila Faye and Myers Faye
Bought by
Mayers Ila Faye
Purchase Details
Closed on
Mar 9, 2006
Sold by
Myers Faye
Bought by
Myers Ila Faye
Home Financials for this Owner
Home Financials are based on the most recent Mortgage that was taken out on this home.
Original Mortgage
$52,500
Interest Rate
6.73%
Mortgage Type
New Conventional
Create a Home Valuation Report for This Property
The Home Valuation Report is an in-depth analysis detailing your home's value as well as a comparison with similar homes in the area
Home Values in the Area
Average Home Value in this Area
Purchase History
| Date | Buyer | Sale Price | Title Company |
|---|---|---|---|
| Hall Jeff | -- | Meridian Title | |
| Overmyer Trust | -- | -- | |
| Horvath Tomeka | $68,500 | None Available | |
| Overmyer Steve H | $21,000 | Prism Title & Closing Servic | |
| Reverse Mortgage Solutions | -- | None Available | |
| World Alliance Financial Corp | -- | None Available | |
| Mayers Ila Faye | -- | None Available | |
| Myers Ila Faye | -- | Merdian Title Corp |
Source: Public Records
Mortgage History
| Date | Status | Borrower | Loan Amount |
|---|---|---|---|
| Previous Owner | Myers Ila Faye | $52,500 | |
| Closed | Horvath Tomeka | $0 |
Source: Public Records
Tax History Compared to Growth
Tax History
| Year | Tax Paid | Tax Assessment Tax Assessment Total Assessment is a certain percentage of the fair market value that is determined by local assessors to be the total taxable value of land and additions on the property. | Land | Improvement |
|---|---|---|---|---|
| 2024 | $1,643 | $154,500 | $45,800 | $108,700 |
| 2022 | $1,758 | $160,900 | $45,800 | $115,100 |
| 2021 | $1,210 | $116,100 | $11,300 | $104,800 |
| 2020 | $1,159 | $112,200 | $10,900 | $101,300 |
| 2019 | $958 | $112,700 | $11,400 | $101,300 |
| 2018 | $834 | $109,300 | $10,900 | $98,400 |
| 2017 | $887 | $106,800 | $10,900 | $95,900 |
| 2016 | $542 | $83,400 | $8,500 | $74,900 |
| 2014 | $555 | $82,100 | $8,500 | $73,600 |
| 2013 | $628 | $79,100 | $9,500 | $69,600 |
Source: Public Records
Map
Nearby Homes
- 20305 Topaz St
- 19711 Pasadena Ave
- 60175 Emerald Dr
- 19570 Dice St
- 19746 Detroit Ave
- Elements 2090 Plan at Lafayette Falls
- Integrity 2061 V8.1a Plan at Lafayette Falls - Integrity
- Integrity 2080 Plan at Lafayette Falls - Integrity
- Integrity 2060 Plan at Lafayette Falls - Integrity
- Integrity 2280 Plan at Lafayette Falls - Integrity
- Elements 2100 Plan at Lafayette Falls
- Elements 2070 Plan at Lafayette Falls
- Elements 2390 Plan at Lafayette Falls
- Elements 2700 Plan at Lafayette Falls
- Traditions 2330 V8.0b Plan at Lafayette Falls - Traditions
- Elements 2200 Plan at Lafayette Falls
- Integrity 2190 Plan at Lafayette Falls - Integrity
- Integrity 2000 Plan at Lafayette Falls - Integrity
- Traditions 2350 V8.0b Plan at Lafayette Falls - Traditions
- 20485 Jewell Ave
- 20165 Pulling St
- 20203 Pulling St
- 20180 Dice St
- 20200 Dice St
- 20151 Pulling St
- 20206 Pulling St
- 20229 Pulling St
- 20150 Dice St
- 20234 Dice St
- 20125 Pulling St
- 20130 Dice St
- 20185 Dice St
- 20201 Dice St
- 20173 Dice St
- 20235 Gilmer St
- 20121 Gilmer St
- 20151 Dice St
- 20124 Pulling St
- 20112 Dice St
- 20219 Dice St