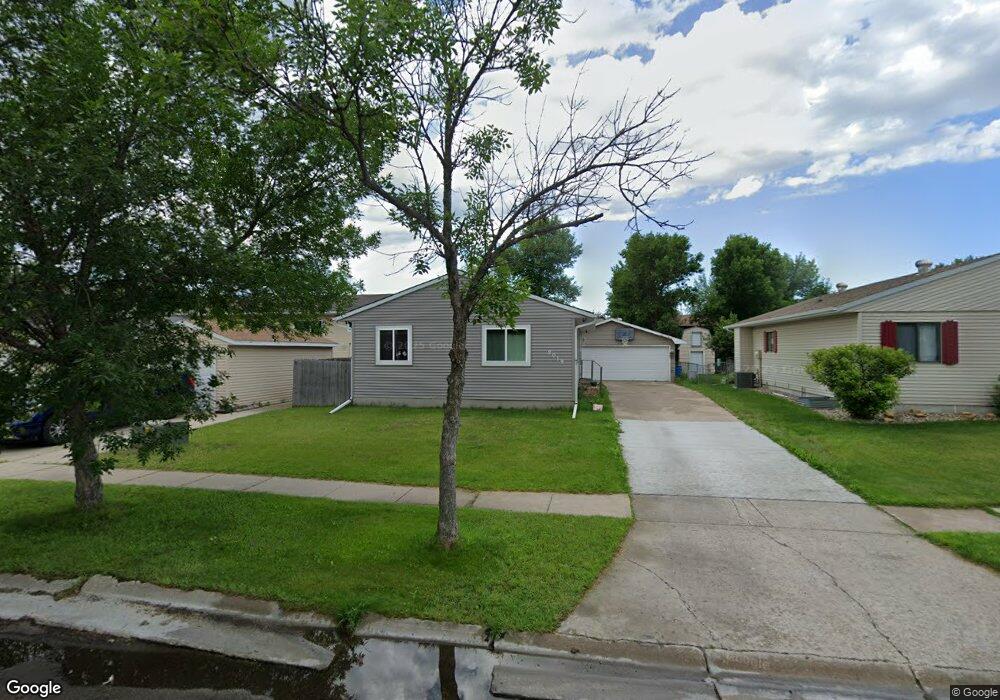
2019 5th Ave E West Fargo, ND 58078
Meadowridge NeighborhoodEstimated Value: $257,000 - $272,889
4
Beds
2
Baths
1,976
Sq Ft
$134/Sq Ft
Est. Value
About This Home
This home is located at 2019 5th Ave E, West Fargo, ND 58078 and is currently estimated at $264,945, approximately $134 per square foot. 2019 5th Ave E is a home located in Cass County with nearby schools including L.E. Berger Elementary School, Cheney Middle School, and West Fargo High School.
Ownership History
Date
Name
Owned For
Owner Type
Purchase Details
Closed on
Apr 17, 2020
Sold by
Jacobson Monty and Jacobson Bonnie Brooke
Bought by
Gerdes Patrick A and Gerdes Ritika Sahni
Current Estimated Value
Home Financials for this Owner
Home Financials are based on the most recent Mortgage that was taken out on this home.
Original Mortgage
$152,800
Outstanding Balance
$134,845
Interest Rate
3.2%
Mortgage Type
New Conventional
Estimated Equity
$130,100
Purchase Details
Closed on
Oct 10, 2014
Sold by
Fallgatter Jeffrey S and Fallgatter Erin
Bought by
Kelly Kara A
Create a Home Valuation Report for This Property
The Home Valuation Report is an in-depth analysis detailing your home's value as well as a comparison with similar homes in the area
Home Values in the Area
Average Home Value in this Area
Purchase History
| Date | Buyer | Sale Price | Title Company |
|---|---|---|---|
| Gerdes Patrick A | $191,000 | Fm Title | |
| Kelly Kara A | $131,400 | Trn Abstract And Title |
Source: Public Records
Mortgage History
| Date | Status | Borrower | Loan Amount |
|---|---|---|---|
| Open | Gerdes Patrick A | $152,800 |
Source: Public Records
Tax History
| Year | Tax Paid | Tax Assessment Tax Assessment Total Assessment is a certain percentage of the fair market value that is determined by local assessors to be the total taxable value of land and additions on the property. | Land | Improvement |
|---|---|---|---|---|
| 2024 | $2,669 | $120,600 | $21,350 | $99,250 |
| 2023 | $3,038 | $115,050 | $21,350 | $93,700 |
| 2022 | $2,944 | $107,150 | $21,350 | $85,800 |
| 2021 | $2,856 | $98,650 | $13,350 | $85,300 |
| 2020 | $2,562 | $90,550 | $13,350 | $77,200 |
| 2019 | $2,514 | $82,900 | $13,350 | $69,550 |
| 2018 | $2,424 | $82,300 | $13,350 | $68,950 |
| 2017 | $2,498 | $81,700 | $13,350 | $68,350 |
| 2016 | $2,208 | $79,750 | $13,350 | $66,400 |
| 2015 | $1,942 | $66,050 | $9,700 | $56,350 |
| 2014 | $1,913 | $61,750 | $9,700 | $52,050 |
| 2013 | $1,962 | $61,750 | $9,700 | $52,050 |
Source: Public Records
Map
Nearby Homes
- 2008 5th Ave E
- 2120 4th Ave E
- 2119 2nd Ave E
- 2150 2nd Ave E
- 804 51st St S
- 1726 2nd Ave E
- 1618 Suntree Dr
- 1610 Suntree Dr
- 921 Homestead Ct
- 1332 Sandstone Dr
- 531 Santa Cruz Dr Unit 333
- 341 Santa Cruz Dr Unit 305
- 1059 Sommerset Place
- 1511 11th Ave E
- 801 9th St E
- 832 5th Ave E
- 1424 14th St E Unit 11
- 4302 13 1 2 Ave S Unit F
- 631 7th Ave E
- 622 12th Ave E
Your Personal Tour Guide
Ask me questions while you tour the home.