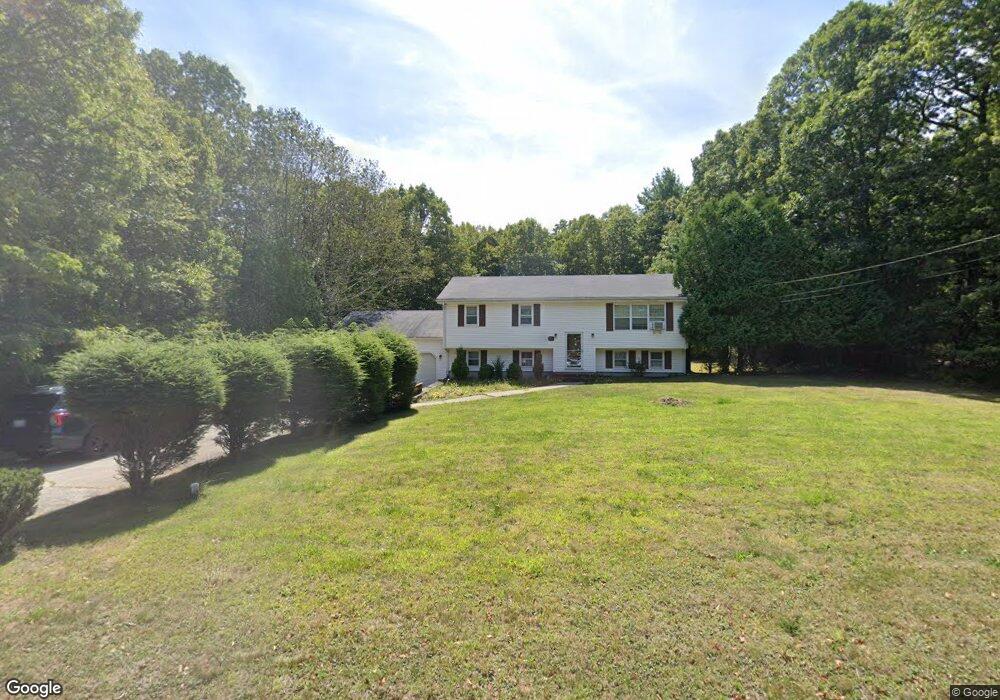
2019 Maple St North Dighton, MA 02764
Estimated Value: $517,818 - $550,000
3
Beds
2
Baths
1,144
Sq Ft
$467/Sq Ft
Est. Value
About This Home
This home is located at 2019 Maple St, North Dighton, MA 02764 and is currently estimated at $533,705, approximately $466 per square foot. 2019 Maple St is a home located in Bristol County with nearby schools including Dighton-Rehoboth Regional High School and Cedar Brook School.
Ownership History
Date
Name
Owned For
Owner Type
Purchase Details
Closed on
Oct 23, 2009
Sold by
Whittle Jean A
Bought by
Mcnamara Sean M
Current Estimated Value
Home Financials for this Owner
Home Financials are based on the most recent Mortgage that was taken out on this home.
Original Mortgage
$272,340
Outstanding Balance
$177,925
Interest Rate
5.09%
Mortgage Type
Purchase Money Mortgage
Estimated Equity
$355,780
Create a Home Valuation Report for This Property
The Home Valuation Report is an in-depth analysis detailing your home's value as well as a comparison with similar homes in the area
Home Values in the Area
Average Home Value in this Area
Purchase History
| Date | Buyer | Sale Price | Title Company |
|---|---|---|---|
| Mcnamara Sean M | $267,000 | -- |
Source: Public Records
Mortgage History
| Date | Status | Borrower | Loan Amount |
|---|---|---|---|
| Open | Mcnamara Sean M | $272,340 |
Source: Public Records
Tax History Compared to Growth
Tax History
| Year | Tax Paid | Tax Assessment Tax Assessment Total Assessment is a certain percentage of the fair market value that is determined by local assessors to be the total taxable value of land and additions on the property. | Land | Improvement |
|---|---|---|---|---|
| 2025 | $5,108 | $406,700 | $134,900 | $271,800 |
| 2024 | $5,088 | $371,900 | $134,500 | $237,400 |
| 2023 | $4,841 | $347,300 | $134,500 | $212,800 |
| 2022 | $4,657 | $325,900 | $131,000 | $194,900 |
| 2021 | $4,483 | $297,200 | $118,400 | $178,800 |
| 2020 | $4,283 | $290,600 | $132,300 | $158,300 |
| 2019 | $4,227 | $282,000 | $132,300 | $149,700 |
| 2018 | $3,990 | $260,800 | $112,300 | $148,500 |
| 2017 | $3,772 | $252,500 | $130,600 | $121,900 |
| 2016 | $3,771 | $247,600 | $134,500 | $113,100 |
| 2015 | $3,730 | $252,000 | $138,400 | $113,600 |
| 2014 | $3,733 | $245,100 | $138,400 | $106,700 |
Source: Public Records
Map
Nearby Homes
- 1030 Oak St
- 2045 Winthrop St
- 0 Horton St Unit 73333337
- 1421 Tremont St
- 0 Monteiro Unit 71870472
- 24 New St
- 2661 Horton St
- 1240 Smith St
- 826 Williams St
- 2713 Horton St
- 701 Winthrop St Unit 312
- 1297 Williams St
- 1026 Tremont St
- 0 Range Ave Unit 72771508
- 0 Range Ave Unit 72771509
- 805 Burt St
- 343 Forest St
- 29 & 43 Francis St
- 0 Wellington St
- 810 Tremont St