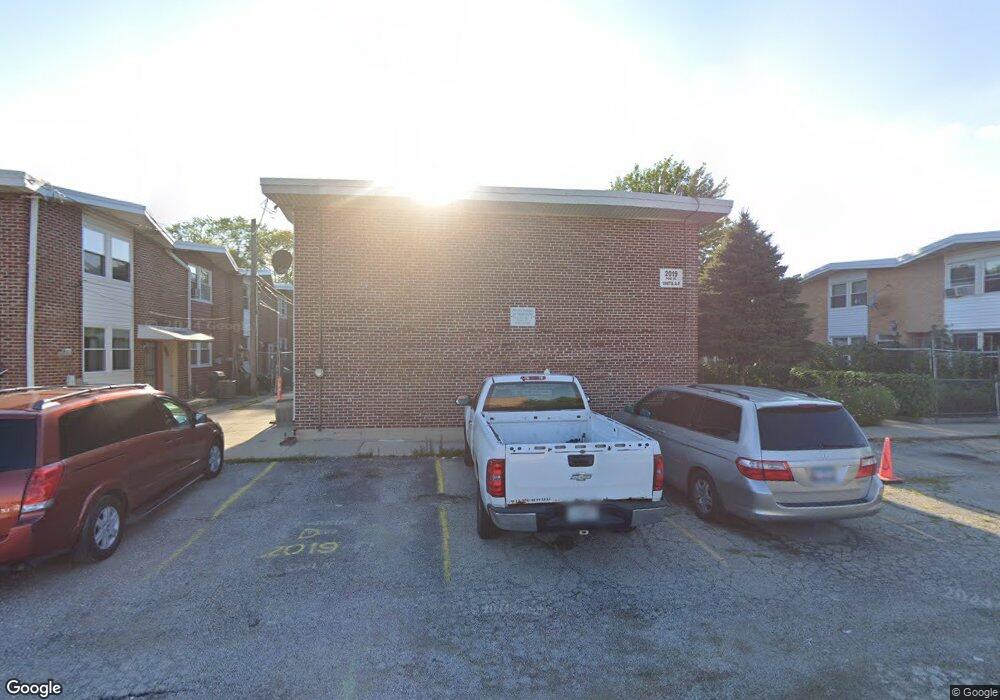
2019 Pine St Des Plaines, IL 60018
Estimated Value: $245,000 - $258,345
3
Beds
2
Baths
1,152
Sq Ft
$219/Sq Ft
Est. Value
About This Home
This home is located at 2019 Pine St, Des Plaines, IL 60018 and is currently estimated at $252,836, approximately $219 per square foot. 2019 Pine St is a home located in Cook County with nearby schools including Plainfield Elementary School, Algonquin Middle School, and Maine West High School.
Ownership History
Date
Name
Owned For
Owner Type
Purchase Details
Closed on
Oct 12, 2007
Sold by
Morataya Elser E
Bought by
Patel Vijaykumar B and Patel Trushaben V
Current Estimated Value
Home Financials for this Owner
Home Financials are based on the most recent Mortgage that was taken out on this home.
Original Mortgage
$151,200
Outstanding Balance
$94,983
Interest Rate
6.33%
Mortgage Type
Unknown
Estimated Equity
$157,853
Purchase Details
Closed on
Aug 28, 1996
Sold by
Morataya Jose
Bought by
Morataya Elser E
Home Financials for this Owner
Home Financials are based on the most recent Mortgage that was taken out on this home.
Original Mortgage
$83,700
Interest Rate
8.29%
Create a Home Valuation Report for This Property
The Home Valuation Report is an in-depth analysis detailing your home's value as well as a comparison with similar homes in the area
Home Values in the Area
Average Home Value in this Area
Purchase History
| Date | Buyer | Sale Price | Title Company |
|---|---|---|---|
| Patel Vijaykumar B | $189,000 | Stewart Title Of Illinois | |
| Morataya Elser E | -- | -- |
Source: Public Records
Mortgage History
| Date | Status | Borrower | Loan Amount |
|---|---|---|---|
| Open | Patel Vijaykumar B | $151,200 | |
| Previous Owner | Morataya Elser E | $83,700 |
Source: Public Records
Tax History Compared to Growth
Tax History
| Year | Tax Paid | Tax Assessment Tax Assessment Total Assessment is a certain percentage of the fair market value that is determined by local assessors to be the total taxable value of land and additions on the property. | Land | Improvement |
|---|---|---|---|---|
| 2024 | $4,135 | $19,000 | $3,000 | $16,000 |
| 2023 | $4,009 | $19,000 | $3,000 | $16,000 |
| 2022 | $4,009 | $19,000 | $3,000 | $16,000 |
| 2021 | $2,824 | $12,518 | $1,452 | $11,066 |
| 2020 | $2,845 | $12,518 | $1,452 | $11,066 |
| 2019 | $2,862 | $14,066 | $1,452 | $12,614 |
| 2018 | $2,905 | $13,149 | $1,281 | $11,868 |
| 2017 | $2,871 | $13,149 | $1,281 | $11,868 |
| 2016 | $2,960 | $13,149 | $1,281 | $11,868 |
| 2015 | $3,171 | $13,112 | $1,110 | $12,002 |
| 2014 | $3,120 | $13,112 | $1,110 | $12,002 |
| 2013 | $3,025 | $13,112 | $1,110 | $12,002 |
Source: Public Records
Map
Nearby Homes
- 2017 Pine St Unit B
- 1783 Lee St
- 1724 Illinois St
- 1696 S Elm St
- 1689 S Elm St
- 1629 E Touhy Ave
- 1641 E Touhy Ave
- 1632 S Elm St
- 1721 Linden St
- 1706 Buckingham Dr
- 2181 Plainfield Dr
- 1509 Center St
- 2500 Maple St
- 1050 E Oakton St
- 1928 Kennicott Ct
- 1640 S River Rd
- 2646 Maple St
- 991 Wicke Ave
- 614 Birchwood Ave
- 1966 Laura Ln
- 2019 Pine St
- 2019 Pine St
- 2019 Pine St
- 2019 Pine St
- 2019 Pine St
- 2019 Pine St Unit D
- 2019 Pine St Unit D
- 2019 Pine St Unit A
- 2019 Pine St Unit E
- 2039 Pine St
- 2039 Pine St
- 2039 Pine St
- 2039 Pine St
- 2039 Pine St
- 2039 Pine St
- 2039 Pine St Unit D
- 2025 Pine St
- 2029 Pine St
- 2031 Pine St
- 2031 Pine St Unit D