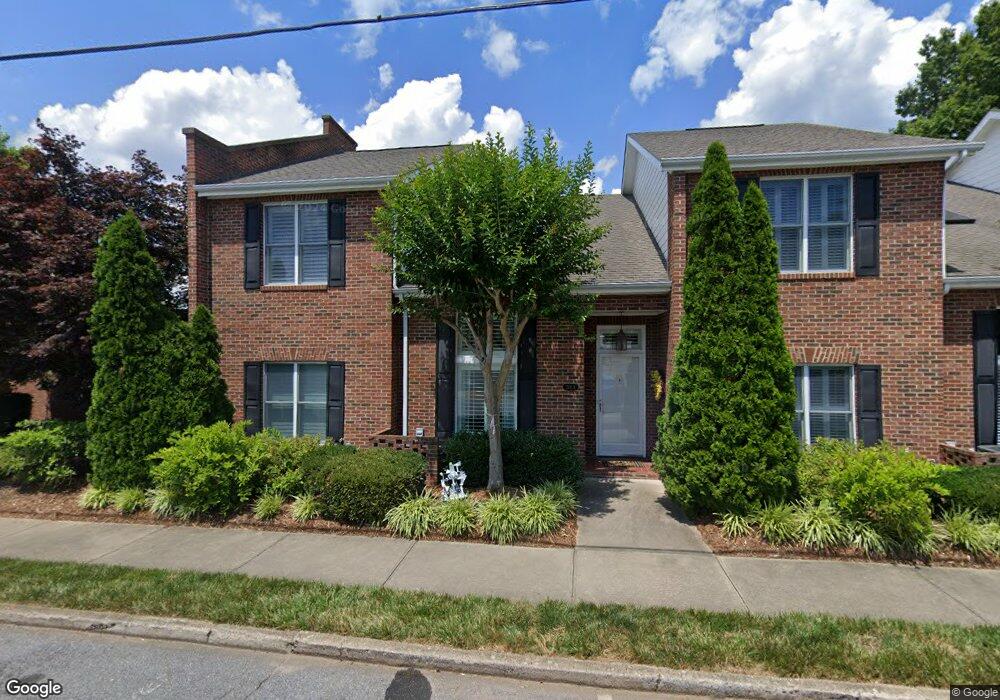
201A S King St Morganton, NC 28655
Estimated Value: $350,000 - $465,000
3
Beds
2
Baths
1,867
Sq Ft
$223/Sq Ft
Est. Value
About This Home
This home is located at 201A S King St, Morganton, NC 28655 and is currently estimated at $416,472, approximately $223 per square foot. 201A S King St is a home located in Burke County with nearby schools including Forest Hill Elementary School, Walter R. Johnson Middle School, and Robert L. Patton High School.
Ownership History
Date
Name
Owned For
Owner Type
Purchase Details
Closed on
Nov 26, 2024
Sold by
Chamberlain Michael M and Chamberlain Lauren
Bought by
Dabb Properties Llc
Current Estimated Value
Purchase Details
Closed on
Feb 3, 2023
Sold by
Whisnant Cates Adair
Bought by
Chamberlain Michael M and Chamberlain Lauren
Purchase Details
Closed on
Aug 25, 2020
Sold by
Cates James B and Cates Georgia K
Bought by
Ford Christopher Wilson and Estate Of James B Cates & Geogria B Cate
Purchase Details
Closed on
Oct 19, 2015
Sold by
Cates James B and Cates Georgia K
Bought by
Cates James B and Cates Georgia K
Purchase Details
Closed on
Jul 22, 2015
Sold by
Mcgimsey Edward C and Mcgimsey Sherri B
Bought by
Cates James B and Cates Georgia K
Purchase Details
Closed on
Oct 9, 2009
Sold by
Mcgimsey Edward C and Mcgimsey Robert M
Bought by
Edwards Margaret Mcgimsey and Mcgimsey Edward C
Create a Home Valuation Report for This Property
The Home Valuation Report is an in-depth analysis detailing your home's value as well as a comparison with similar homes in the area
Home Values in the Area
Average Home Value in this Area
Purchase History
| Date | Buyer | Sale Price | Title Company |
|---|---|---|---|
| Dabb Properties Llc | -- | None Listed On Document | |
| Dabb Properties Llc | -- | None Listed On Document | |
| Chamberlain Michael M | $350,000 | None Listed On Document | |
| Chamberlain Michael M | $350,000 | -- | |
| Ford Christopher Wilson | -- | None Available | |
| Cates James B | -- | Attorney | |
| Cates James B | $185,000 | Attorney | |
| Edwards Margaret Mcgimsey | -- | None Available |
Source: Public Records
Tax History
| Year | Tax Paid | Tax Assessment Tax Assessment Total Assessment is a certain percentage of the fair market value that is determined by local assessors to be the total taxable value of land and additions on the property. | Land | Improvement |
|---|---|---|---|---|
| 2025 | $1,848 | $315,482 | $30,000 | $285,482 |
| 2024 | $1,860 | $315,482 | $30,000 | $285,482 |
| 2023 | $1,679 | $315,482 | $30,000 | $285,482 |
| 2022 | $1,610 | $219,799 | $30,000 | $189,799 |
| 2021 | $1,604 | $219,799 | $30,000 | $189,799 |
| 2020 | $1,600 | $219,799 | $30,000 | $189,799 |
| 2019 | $1,600 | $219,799 | $30,000 | $189,799 |
| 2018 | $1,420 | $194,027 | $16,880 | $177,147 |
| 2017 | $1,418 | $194,027 | $16,880 | $177,147 |
| 2016 | $1,384 | $194,027 | $16,880 | $177,147 |
| 2015 | $1,379 | $193,619 | $16,880 | $176,739 |
| 2014 | $1,377 | $193,619 | $16,880 | $176,739 |
| 2013 | $1,377 | $193,619 | $16,880 | $176,739 |
Source: Public Records
Map
Nearby Homes
- 118 W Union St Unit Suite A
- 118 W Union St Unit A
- 302 White St
- 406B E Union St
- 406 E Union St Unit B
- VL E Concord St
- 103 Ramsey St
- 214 Howard St
- 302 Ramsey St
- 430 N Green St
- 710 Bouchelle St
- 106 Lane St Unit 6
- 218 Davis Dr
- 214 Eastview St
- 212 Riverside Dr
- Lot 4 Lane St Unit 4
- Lot 5 Lane St Unit 5
- Lot 3 Lane St Unit 3
- Lot 6 Lane St Unit 6
- 626 W Concord St
- 201C S King St
- 201B S King St
- 123 W Meeting St
- 121 W Meeting St
- 119 W Meeting St
- 205 S King St
- 117 W Meeting St
- 203 S King St Unit D
- 203 S King St Unit C
- 203 S King St Unit A
- 203 S King St Unit B
- 203 S King St
- 115 W Meeting St
- 207 S King St
- 12 Ac Wild Turkey Way
- 104 W Concord St
- 202 S Sterling St
- 204 S King St
- 106 S King St
- 00 Wild Turkey Way
Your Personal Tour Guide
Ask me questions while you tour the home.