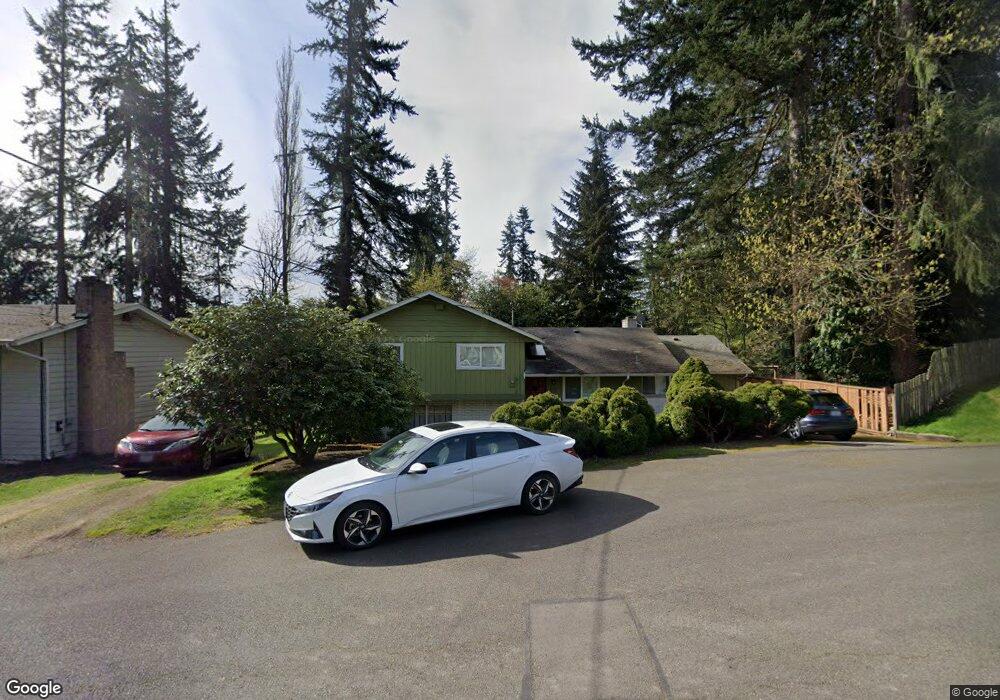
202 160th St SE Bothell, WA 98012
Estimated Value: $639,000 - $816,000
3
Beds
3
Baths
2,404
Sq Ft
$309/Sq Ft
Est. Value
About This Home
This home is located at 202 160th St SE, Bothell, WA 98012 and is currently estimated at $742,484, approximately $308 per square foot. 202 160th St SE is a home located in Snohomish County with nearby schools including Oak Heights Elementary School, Alderwood Middle School, and Lynnwood High School.
Ownership History
Date
Name
Owned For
Owner Type
Purchase Details
Closed on
Aug 17, 2018
Sold by
Polestar Investment Inc
Bought by
Polestar Investment Llc
Current Estimated Value
Purchase Details
Closed on
Oct 2, 2015
Sold by
Canada Trading Corp
Bought by
Polestar Investment Inc
Purchase Details
Closed on
Jul 7, 2011
Sold by
Deutsche Bank Trust Company Americas
Bought by
Won Ji Canada Trading Corp
Purchase Details
Closed on
Dec 28, 2010
Sold by
Hartwick Robert B and Harris Frances M
Bought by
Deutsche Bank Trust Company Americas
Purchase Details
Closed on
Jul 11, 2005
Sold by
Stevens Wayne R and Stevens Lindola C
Bought by
Hartwick Robert B and Harris Frances M
Home Financials for this Owner
Home Financials are based on the most recent Mortgage that was taken out on this home.
Original Mortgage
$71,000
Interest Rate
5.12%
Mortgage Type
Stand Alone Second
Create a Home Valuation Report for This Property
The Home Valuation Report is an in-depth analysis detailing your home's value as well as a comparison with similar homes in the area
Home Values in the Area
Average Home Value in this Area
Purchase History
| Date | Buyer | Sale Price | Title Company |
|---|---|---|---|
| Polestar Investment Llc | -- | None Available | |
| Polestar Investment Inc | -- | None Available | |
| Won Ji Canada Trading Corp | $155,280 | Fidelity Natl Title Ins Co | |
| Deutsche Bank Trust Company Americas | $284,000 | None Available | |
| Hartwick Robert B | $355,000 | Old Republic Title Ltd |
Source: Public Records
Mortgage History
| Date | Status | Borrower | Loan Amount |
|---|---|---|---|
| Previous Owner | Hartwick Robert B | $71,000 | |
| Previous Owner | Hartwick Robert B | $284,000 |
Source: Public Records
Tax History
| Year | Tax Paid | Tax Assessment Tax Assessment Total Assessment is a certain percentage of the fair market value that is determined by local assessors to be the total taxable value of land and additions on the property. | Land | Improvement |
|---|---|---|---|---|
| 2026 | $4,542 | $681,800 | $495,000 | $186,800 |
| 2025 | $4,393 | $541,300 | $435,000 | $106,300 |
| 2024 | $4,393 | $521,200 | $415,000 | $106,200 |
| 2023 | $4,656 | $579,000 | $470,000 | $109,000 |
| 2022 | $4,447 | $450,400 | $362,000 | $88,400 |
| 2020 | $4,072 | $365,500 | $281,000 | $84,500 |
| 2019 | $3,636 | $323,900 | $240,000 | $83,900 |
| 2018 | $3,571 | $280,200 | $205,000 | $75,200 |
| 2017 | $2,848 | $229,900 | $165,000 | $64,900 |
| 2016 | $2,487 | $200,400 | $149,000 | $51,400 |
| 2015 | $2,476 | $189,600 | $133,000 | $56,600 |
| 2013 | $2,399 | $174,600 | $117,000 | $57,600 |
Source: Public Records
Map
Nearby Homes
- 109 161st Place SE
- 15727 Cascadian Way
- 17 160th Place SE
- 31 157th Ln SE
- 16 160th Place SE
- 107 164th St SE Unit 2103
- 107 164th St SE Unit 2-301
- 11 160th Place SE
- 16011 2nd Place W
- 16230 3rd Ave SE Unit A1
- 15 164th St SW Unit 2
- 201 156th Place SW Unit MG 13
- 231 156th Place SW Unit MG 05
- 217 156th Place SW Unit MG 09
- 129 164th Place SE
- 15 xxx 3rd Ave SE
- 224 157th Place SW
- 16528 2nd Park SE
- 15327 3rd Dr SE
- 16719 1st Ave SE
- 204 160th St SE
- 9 160th St SE
- 18 160th St SE
- 20 160th St SE
- 213 161st St SE
- 215 161st St SE
- 208 160th St SE
- 16025 Cascadian Way
- 203 160th St SE
- 126 160th St SE
- 207 160th St SE
- 217 161st St SE
- 124 160th St SE
- 123 160th St SE
- 220 160th St SE
- 121 161st St SE
- 121 161st St SE Unit 7
- 206 161st St SE
- 221 161st St SE
- 206 159th St SE
Your Personal Tour Guide
Ask me questions while you tour the home.