Estimated Value: $161,000 - $209,000
--
Bed
--
Bath
--
Sq Ft
8,973
Sq Ft Lot
About This Home
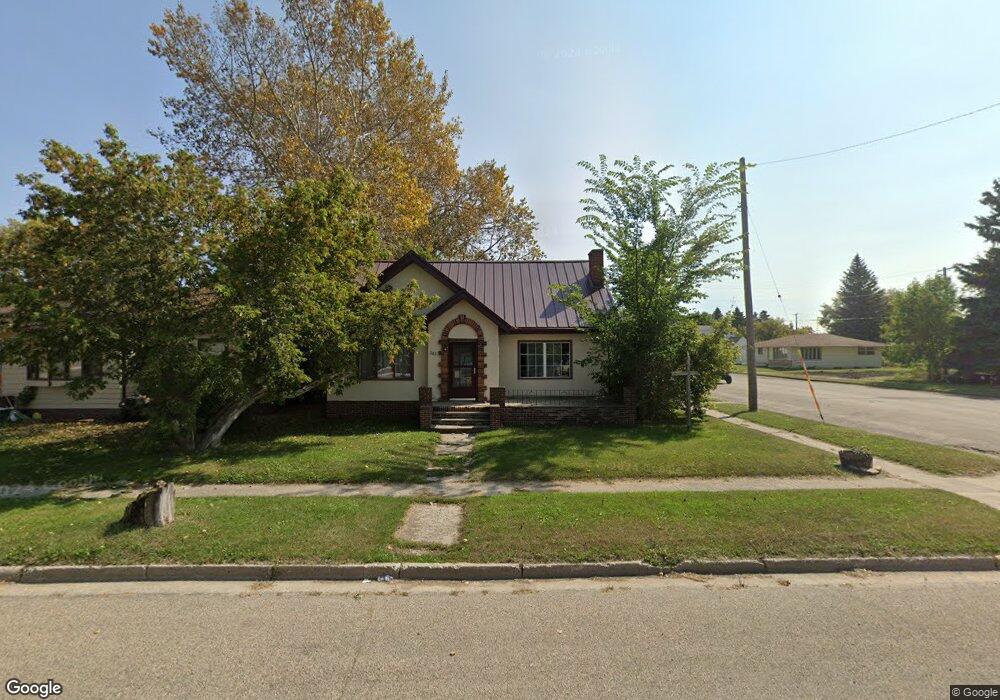
This home is located at 202 1st Ave SE, Rolla, ND 58367 and is currently estimated at $179,909. 202 1st Ave SE is a home with nearby schools including Mt. Pleasant Elementary School and Mt. Pleasant High School.
Ownership History
Date
Name
Owned For
Owner Type
Purchase Details
Closed on
Jan 10, 2020
Sold by
Wuori Luke T and Wuori Breanna
Bought by
Haberstroh Cole K
Current Estimated Value
Home Financials for this Owner
Home Financials are based on the most recent Mortgage that was taken out on this home.
Original Mortgage
$105,125
Interest Rate
3.74%
Mortgage Type
Commercial
Purchase Details
Closed on
Oct 12, 2016
Sold by
Thompson Patrick
Bought by
Wuori Luke T
Home Financials for this Owner
Home Financials are based on the most recent Mortgage that was taken out on this home.
Original Mortgage
$111,110
Interest Rate
3.46%
Mortgage Type
New Conventional
Purchase Details
Closed on
May 21, 2014
Sold by
Lavallie Christine
Bought by
Thompson Patrick
Create a Home Valuation Report for This Property
The Home Valuation Report is an in-depth analysis detailing your home's value as well as a comparison with similar homes in the area
Home Values in the Area
Average Home Value in this Area
Purchase History
| Date | Buyer | Sale Price | Title Company |
|---|---|---|---|
| Haberstroh Cole K | $120,000 | None Available | |
| Wuori Luke T | -- | None Available | |
| Thompson Patrick | -- | None Available |
Source: Public Records
Mortgage History
| Date | Status | Borrower | Loan Amount |
|---|---|---|---|
| Closed | Haberstroh Cole K | $105,125 | |
| Previous Owner | Wuori Luke T | $111,110 |
Source: Public Records
Tax History Compared to Growth
Tax History
| Year | Tax Paid | Tax Assessment Tax Assessment Total Assessment is a certain percentage of the fair market value that is determined by local assessors to be the total taxable value of land and additions on the property. | Land | Improvement |
|---|---|---|---|---|
| 2025 | $5,834 | $64,829 | $2,161 | $62,668 |
| 2024 | $1,961 | $56,900 | $1,900 | $55,000 |
| 2023 | $1,792 | $56,900 | $1,900 | $55,000 |
| 2022 | $1,677 | $53,650 | $1,800 | $51,850 |
| 2021 | $1,758 | $52,100 | $1,750 | $50,350 |
| 2020 | $1,725 | $52,100 | $1,750 | $50,350 |
| 2019 | $1,722 | $52,100 | $1,750 | $50,350 |
| 2018 | $1,602 | $50,065 | $1,670 | $48,395 |
| 2017 | $1,608 | $50,065 | $1,670 | $48,395 |
| 2016 | $1,549 | $50,065 | $1,670 | $48,395 |
Source: Public Records
Map
Nearby Homes