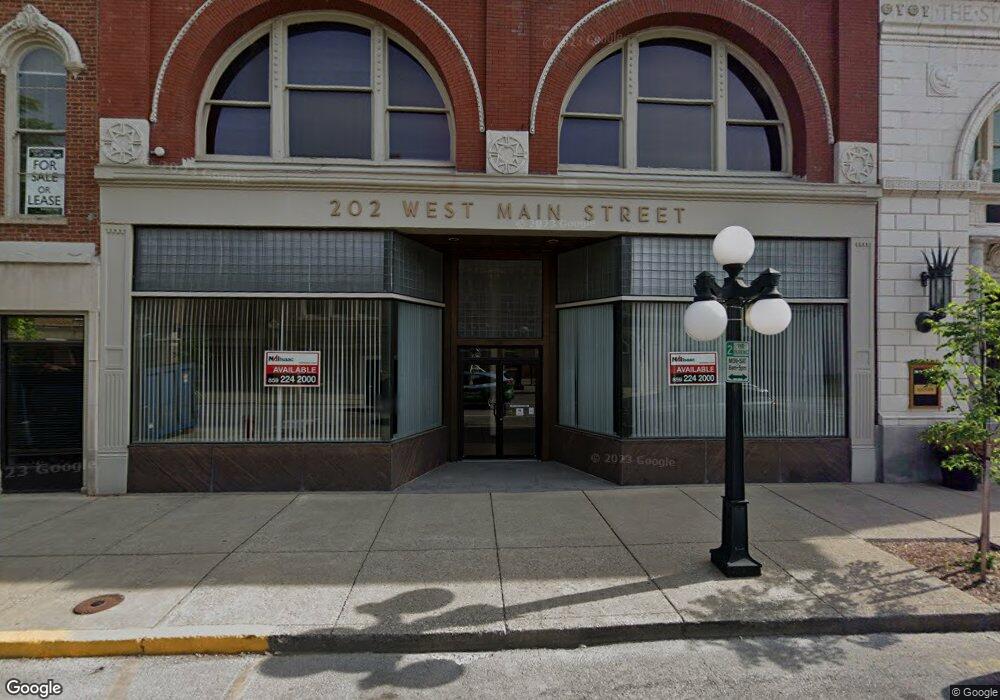
202-204 W Main St Frankfort, KY 40601
Estimated Value: $1,042,039
--
Bed
--
Bath
12,000
Sq Ft
$87/Sq Ft
Est. Value
About This Home
This home is located at 202-204 W Main St, Frankfort, KY 40601 and is currently estimated at $1,042,039, approximately $86 per square foot. 202-204 W Main St is a home located in Franklin County with nearby schools including Second Street School, Frankfort High School, and Capital Day School.
Ownership History
Date
Name
Owned For
Owner Type
Purchase Details
Closed on
Dec 14, 2023
Sold by
West Main Partners Llc
Bought by
M & M Real Estate Ventures Llc
Current Estimated Value
Home Financials for this Owner
Home Financials are based on the most recent Mortgage that was taken out on this home.
Original Mortgage
$807,500
Outstanding Balance
$772,987
Interest Rate
7.44%
Mortgage Type
Construction
Estimated Equity
$269,052
Purchase Details
Closed on
Dec 9, 2022
Sold by
Wesbanco Bank Inc
Bought by
West Man Partners Llc
Home Financials for this Owner
Home Financials are based on the most recent Mortgage that was taken out on this home.
Original Mortgage
$1,000,000
Interest Rate
7.08%
Mortgage Type
Construction
Create a Home Valuation Report for This Property
The Home Valuation Report is an in-depth analysis detailing your home's value as well as a comparison with similar homes in the area
Home Values in the Area
Average Home Value in this Area
Purchase History
| Date | Buyer | Sale Price | Title Company |
|---|---|---|---|
| M & M Real Estate Ventures Llc | $950,000 | None Listed On Document | |
| West Man Partners Llc | $800,000 | -- | |
| West Man Partners Llc | $800,000 | None Listed On Document |
Source: Public Records
Mortgage History
| Date | Status | Borrower | Loan Amount |
|---|---|---|---|
| Open | M & M Real Estate Ventures Llc | $807,500 | |
| Previous Owner | West Man Partners Llc | $1,000,000 |
Source: Public Records
Tax History Compared to Growth
Tax History
| Year | Tax Paid | Tax Assessment Tax Assessment Total Assessment is a certain percentage of the fair market value that is determined by local assessors to be the total taxable value of land and additions on the property. | Land | Improvement |
|---|---|---|---|---|
| 2025 | $4,332 | $950,000 | $0 | $0 |
| 2024 | $4,427 | $950,000 | $0 | $0 |
| 2023 | $1,872 | $395,000 | $0 | $0 |
| 2022 | $4,787 | $395,000 | $0 | $0 |
| 2021 | $1,879 | $395,000 | $0 | $0 |
| 2020 | $1,806 | $375,000 | $85,000 | $290,000 |
| 2019 | $1,807 | $375,000 | $85,000 | $290,000 |
| 2018 | $1,844 | $375,000 | $85,000 | $290,000 |
| 2017 | $4,099 | $375,000 | $85,000 | $290,000 |
| 2016 | $1,749 | $375,000 | $85,000 | $290,000 |
| 2015 | $5,119 | $375,000 | $85,000 | $290,000 |
| 2011 | $5,119 | $375,000 | $85,000 | $290,000 |
Source: Public Records
Map
Nearby Homes
- 212 Washington St
- 413 W Broadway St
- 501 W Broadway St
- 519 Ann St
- 10 U S 421
- 312 Conway St
- 316 Logan St
- 133 Wallace Ave
- 311 Second E St
- 396 Ewing St
- 214 W Campbell St
- 218 W Campbell St
- 205 Paul Sawyier Dr
- 207 Paul Sawyier Dr
- 702 Kentucky Ave
- 726 Benson Ave
- 219 Holmes St
- 712 Dabney St
- 2033 Berry Hill Dr
- 1121 Leawood Dr