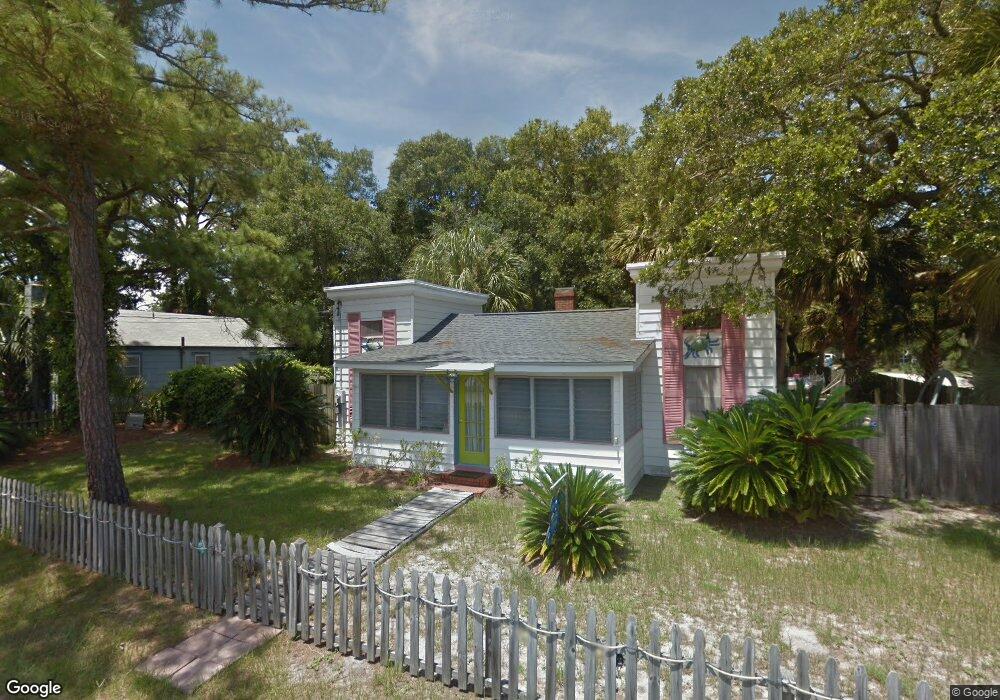
202 8th St Tybee Island, GA 31328
Estimated Value: $532,000 - $600,000
3
Beds
1
Bath
966
Sq Ft
$585/Sq Ft
Est. Value
About This Home
This home is located at 202 8th St, Tybee Island, GA 31328 and is currently estimated at $564,781, approximately $584 per square foot. 202 8th St is a home located in Chatham County with nearby schools including Howard Elementary School, Coastal Middle School, and Islands High School.
Ownership History
Date
Name
Owned For
Owner Type
Purchase Details
Closed on
Dec 21, 2016
Sold by
Frederick Harris
Bought by
Hodge Fredrick Harris and Hodge Cheryl F
Current Estimated Value
Purchase Details
Closed on
Aug 6, 2012
Sold by
Hodge David Brainerd
Bought by
Hodge Frederick Harris
Create a Home Valuation Report for This Property
The Home Valuation Report is an in-depth analysis detailing your home's value as well as a comparison with similar homes in the area
Home Values in the Area
Average Home Value in this Area
Purchase History
| Date | Buyer | Sale Price | Title Company |
|---|---|---|---|
| Hodge Fredrick Harris | -- | -- | |
| Hodge Frederick Harris | $120,000 | -- | |
| Hodge Frederick Harris | -- | -- |
Source: Public Records
Tax History
| Year | Tax Paid | Tax Assessment Tax Assessment Total Assessment is a certain percentage of the fair market value that is determined by local assessors to be the total taxable value of land and additions on the property. | Land | Improvement |
|---|---|---|---|---|
| 2025 | $7,032 | $224,000 | $173,840 | $50,160 |
| 2024 | $62 | $224,000 | $173,840 | $50,160 |
| 2023 | $6,200 | $230,160 | $180,000 | $50,160 |
| 2022 | $4,555 | $225,280 | $180,000 | $45,280 |
| 2021 | $4,420 | $135,520 | $81,000 | $54,520 |
| 2020 | $4,822 | $140,360 | $81,000 | $59,360 |
| 2019 | $4,822 | $140,360 | $81,000 | $59,360 |
| 2018 | $4,470 | $125,880 | $81,000 | $44,880 |
| 2017 | $4,628 | $143,640 | $112,840 | $30,800 |
| 2016 | $4,311 | $133,800 | $112,840 | $20,960 |
| 2015 | $4,046 | $125,400 | $103,640 | $21,760 |
| 2014 | $5,598 | $117,280 | $0 | $0 |
Source: Public Records
Map
Nearby Homes
Your Personal Tour Guide
Ask me questions while you tour the home.