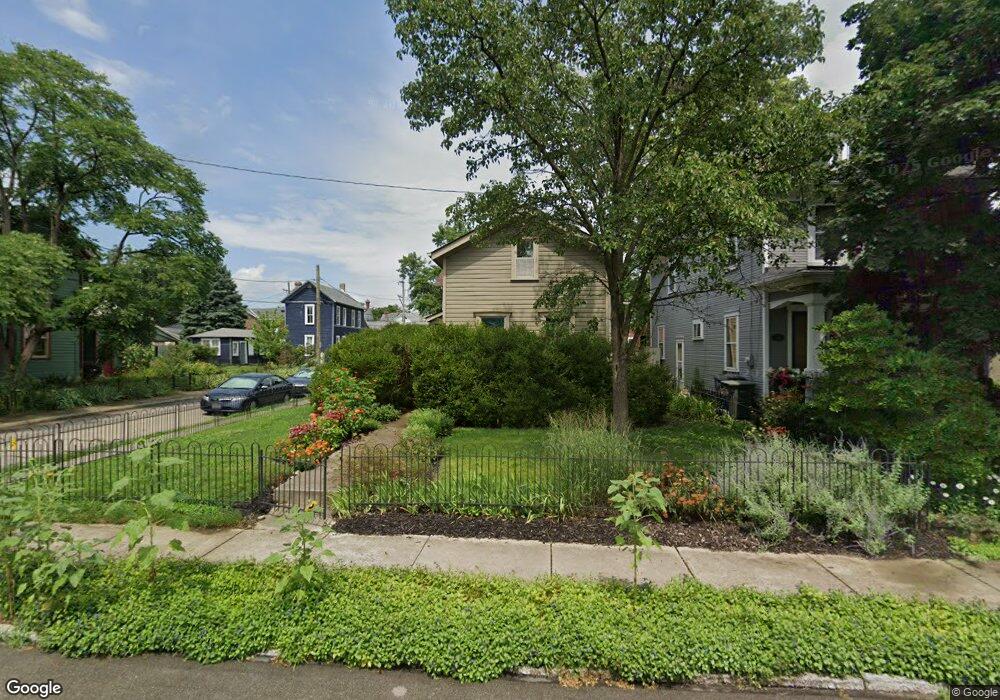
202 Alberta St Dayton, OH 45410
South Park NeighborhoodEstimated Value: $177,000 - $209,000
1
Bed
1
Bath
1,286
Sq Ft
$147/Sq Ft
Est. Value
About This Home
This home is located at 202 Alberta St, Dayton, OH 45410 and is currently estimated at $188,631, approximately $146 per square foot. 202 Alberta St is a home located in Montgomery County with nearby schools including Ruskin Elementary School, Kiser Elementary, and Emerson Academy.
Ownership History
Date
Name
Owned For
Owner Type
Purchase Details
Closed on
Jan 28, 2002
Sold by
Rehabarama South Park Ltd Partnership
Bought by
Ballard Lloyd L and Hinkle Ballard Wanda Fayrene
Current Estimated Value
Home Financials for this Owner
Home Financials are based on the most recent Mortgage that was taken out on this home.
Original Mortgage
$98,900
Outstanding Balance
$39,758
Interest Rate
7.26%
Estimated Equity
$148,873
Purchase Details
Closed on
Jan 31, 2000
Sold by
Julian Investment Group Ii Inc
Bought by
Citywide Development Corp
Purchase Details
Closed on
Feb 7, 1996
Sold by
Jollay Robert A
Bought by
Julian Investment Group Ii Inc
Create a Home Valuation Report for This Property
The Home Valuation Report is an in-depth analysis detailing your home's value as well as a comparison with similar homes in the area
Home Values in the Area
Average Home Value in this Area
Purchase History
| Date | Buyer | Sale Price | Title Company |
|---|---|---|---|
| Ballard Lloyd L | $102,000 | -- | |
| Citywide Development Corp | $33,000 | -- | |
| Julian Investment Group Ii Inc | -- | -- |
Source: Public Records
Mortgage History
| Date | Status | Borrower | Loan Amount |
|---|---|---|---|
| Open | Ballard Lloyd L | $98,900 | |
| Closed | Ballard Lloyd L | $2,040 |
Source: Public Records
Tax History
| Year | Tax Paid | Tax Assessment Tax Assessment Total Assessment is a certain percentage of the fair market value that is determined by local assessors to be the total taxable value of land and additions on the property. | Land | Improvement |
|---|---|---|---|---|
| 2025 | $3,507 | $53,960 | $11,910 | $42,050 |
| 2024 | $3,264 | $53,960 | $11,910 | $42,050 |
| 2023 | $3,264 | $53,960 | $11,910 | $42,050 |
| 2022 | $3,137 | $40,020 | $8,820 | $31,200 |
| 2021 | $3,121 | $40,020 | $8,820 | $31,200 |
| 2020 | $3,115 | $40,020 | $8,820 | $31,200 |
| 2019 | $2,789 | $32,050 | $8,820 | $23,230 |
| 2018 | $2,793 | $32,050 | $8,820 | $23,230 |
| 2017 | $2,773 | $32,050 | $8,820 | $23,230 |
| 2016 | $967 | $24,332 | $0 | $24,332 |
| 2015 | $926 | $24,332 | $0 | $24,332 |
| 2014 | $926 | $8,820 | $8,820 | $0 |
| 2012 | -- | $8,820 | $8,820 | $0 |
Source: Public Records
Map
Nearby Homes
Your Personal Tour Guide
Ask me questions while you tour the home.