Estimated Value: $229,884 - $248,000
3
Beds
2
Baths
1,430
Sq Ft
$167/Sq Ft
Est. Value
About This Home
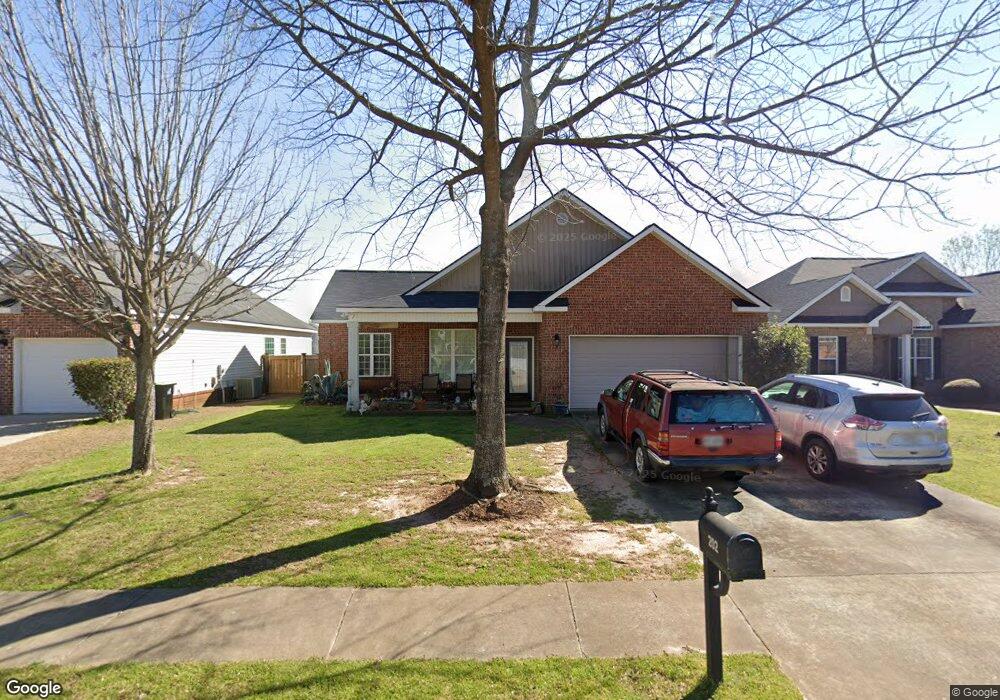
This home is located at 202 Amber Dr, Byron, GA 31008 and is currently estimated at $238,721, approximately $166 per square foot. 202 Amber Dr is a home located in Peach County with nearby schools including Byron Elementary School, Byron Middle School, and Peach County High School.
Ownership History
Date
Name
Owned For
Owner Type
Purchase Details
Closed on
Apr 15, 2021
Sold by
Sandefur Tiffany
Bought by
Sandefur Tiffany and Sandefur Christopher Brian
Current Estimated Value
Home Financials for this Owner
Home Financials are based on the most recent Mortgage that was taken out on this home.
Original Mortgage
$123,500
Outstanding Balance
$90,211
Interest Rate
3%
Mortgage Type
New Conventional
Estimated Equity
$148,510
Purchase Details
Closed on
Jan 4, 2016
Sold by
Lane Elizabeth A
Bought by
Peavy Tiffany N
Home Financials for this Owner
Home Financials are based on the most recent Mortgage that was taken out on this home.
Original Mortgage
$129,609
Interest Rate
3.75%
Mortgage Type
FHA
Purchase Details
Closed on
Sep 4, 2009
Sold by
Caleb Properties Llc
Bought by
Lane Elizabeth A
Home Financials for this Owner
Home Financials are based on the most recent Mortgage that was taken out on this home.
Original Mortgage
$140,816
Interest Rate
5.15%
Mortgage Type
New Conventional
Purchase Details
Closed on
Mar 14, 2006
Sold by
Caleb Properties Llc
Bought by
Preston Development Llc
Purchase Details
Closed on
Mar 7, 2006
Sold by
Preston Development Llc
Bought by
Caleb Properties Llc
Create a Home Valuation Report for This Property
The Home Valuation Report is an in-depth analysis detailing your home's value as well as a comparison with similar homes in the area
Home Values in the Area
Average Home Value in this Area
Purchase History
| Date | Buyer | Sale Price | Title Company |
|---|---|---|---|
| Sandefur Tiffany | -- | -- | |
| Peavy Tiffany N | $132,000 | -- | |
| Lane Elizabeth A | $138,000 | -- | |
| Preston Development Llc | $50,000 | -- | |
| Caleb Properties Llc | -- | -- |
Source: Public Records
Mortgage History
| Date | Status | Borrower | Loan Amount |
|---|---|---|---|
| Open | Sandefur Tiffany | $123,500 | |
| Previous Owner | Peavy Tiffany N | $129,609 | |
| Previous Owner | Lane Elizabeth A | $140,816 |
Source: Public Records
Tax History
| Year | Tax Paid | Tax Assessment Tax Assessment Total Assessment is a certain percentage of the fair market value that is determined by local assessors to be the total taxable value of land and additions on the property. | Land | Improvement |
|---|---|---|---|---|
| 2025 | $2,249 | $73,120 | $8,880 | $64,240 |
| 2024 | $2,300 | $65,960 | $8,720 | $57,240 |
| 2023 | $2,287 | $65,160 | $7,000 | $58,160 |
| 2022 | $1,508 | $58,000 | $7,000 | $51,000 |
| 2021 | $1,482 | $49,480 | $7,000 | $42,480 |
| 2020 | $1,452 | $48,520 | $7,000 | $41,520 |
| 2019 | $1,460 | $48,520 | $7,000 | $41,520 |
| 2018 | $1,467 | $48,520 | $7,000 | $41,520 |
| 2017 | $1,524 | $48,080 | $7,000 | $41,080 |
| 2016 | $1,517 | $48,080 | $7,000 | $41,080 |
| 2015 | $1,520 | $48,080 | $7,000 | $41,080 |
| 2014 | $1,522 | $48,080 | $7,000 | $41,080 |
| 2013 | -- | $48,080 | $7,000 | $41,080 |
Source: Public Records
Map
Nearby Homes
- 422 Lamplight Dr
- 217 Caleb Way
- 412 Lamplight Dr
- 260 Caleb Way
- The Coleman Plan at Cobblestone Crossing
- The Phoenix Plan at Cobblestone Crossing
- The Crawford Plan at Cobblestone Crossing
- The Piedmont Plan at Cobblestone Crossing
- The Bradley Plan at Cobblestone Crossing
- The Caldwell Plan at Cobblestone Crossing
- The McGinnis Plan at Cobblestone Crossing
- 205 Burr Dr
- 508 Timberwind Dr
- 105 Vineyard Trace
- 104 Monroe Ct
- 102 Monroe Ct
- 107 Monroe Ct
- 100 Monroe Ct
- 508 Georgian Walk
- 706 Georgian Walk