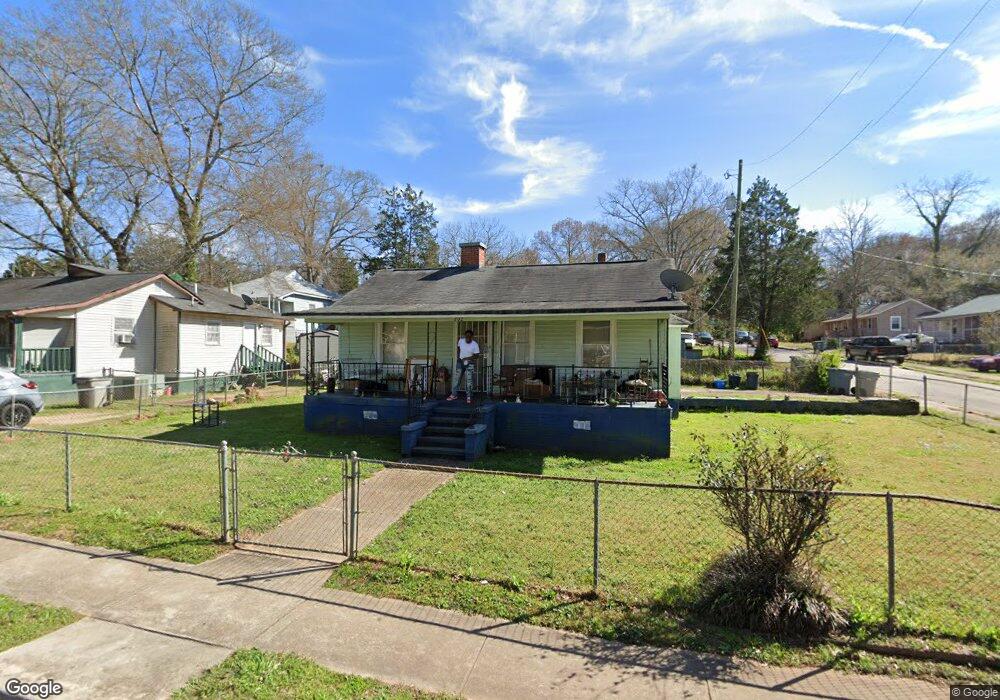
202 Baugh St Lagrange, GA 30241
Estimated Value: $58,059 - $79,000
3
Beds
1
Bath
812
Sq Ft
$84/Sq Ft
Est. Value
About This Home
This home is located at 202 Baugh St, Lagrange, GA 30241 and is currently estimated at $68,015, approximately $83 per square foot. 202 Baugh St is a home located in Troup County with nearby schools including Hollis Hand Elementary School, Franklin Forest Elementary School, and Ethel W. Kight Elementary School.
Ownership History
Date
Name
Owned For
Owner Type
Purchase Details
Closed on
Feb 9, 2017
Sold by
Duong Tuyet Thi
Bought by
Volcy Leonce
Current Estimated Value
Purchase Details
Closed on
Oct 10, 2012
Sold by
Calhoun Mary
Bought by
Duong Tuyet Thi
Purchase Details
Closed on
Oct 27, 2004
Sold by
Esther Jennings
Bought by
Calhoun Mary
Purchase Details
Closed on
Feb 10, 1994
Sold by
Calhoun Mary and Calhoun Hubert
Bought by
Esther Jennings
Purchase Details
Closed on
Oct 17, 1977
Sold by
Hudgins Hubert and Hudgins Mary
Bought by
Calhoun Mary and Calhoun Hubert
Purchase Details
Closed on
Apr 2, 1976
Sold by
Evans
Bought by
Hudgins Hubert and Hudgins Mary
Purchase Details
Closed on
Jan 1, 1972
Sold by
Carter
Bought by
Evans
Purchase Details
Closed on
Jan 1, 1964
Sold by
Davis Ida Warren
Bought by
Carter
Create a Home Valuation Report for This Property
The Home Valuation Report is an in-depth analysis detailing your home's value as well as a comparison with similar homes in the area
Home Values in the Area
Average Home Value in this Area
Purchase History
| Date | Buyer | Sale Price | Title Company |
|---|---|---|---|
| Volcy Leonce | $36,000 | -- | |
| Duong Tuyet Thi | $20,000 | -- | |
| Calhoun Mary | -- | -- | |
| Esther Jennings | -- | -- | |
| Calhoun Mary | $12,300 | -- | |
| Hudgins Hubert | -- | -- | |
| Evans | $6,700 | -- | |
| Carter | -- | -- |
Source: Public Records
Tax History Compared to Growth
Tax History
| Year | Tax Paid | Tax Assessment Tax Assessment Total Assessment is a certain percentage of the fair market value that is determined by local assessors to be the total taxable value of land and additions on the property. | Land | Improvement |
|---|---|---|---|---|
| 2024 | $439 | $16,080 | $2,840 | $13,240 |
| 2023 | $441 | $16,160 | $2,840 | $13,320 |
| 2022 | $419 | $15,000 | $2,840 | $12,160 |
| 2021 | $403 | $13,360 | $1,000 | $12,360 |
| 2020 | $403 | $13,360 | $1,000 | $12,360 |
| 2019 | $375 | $12,440 | $1,000 | $11,440 |
| 2018 | $396 | $13,144 | $1,104 | $12,040 |
| 2017 | $336 | $13,144 | $1,104 | $12,040 |
| 2016 | $282 | $11,326 | $1,104 | $10,222 |
| 2015 | $282 | $11,326 | $1,104 | $10,222 |
| 2014 | $267 | $10,788 | $1,104 | $9,684 |
| 2013 | -- | $11,193 | $1,104 | $10,089 |
Source: Public Records
Map
Nearby Homes
- 101 McGee St
- 910 N 916 1000 1002 N Oak & 1011 1019 1021 Johnson St
- 803 1/2 Hines St
- 141 Main St
- 519 Greenville St
- 0 Locust St
- 801 Hines St
- 105 Dix St
- 203 Fannin St
- 208 Render St
- 205 Fannin St
- 0 Burr St
- 306 Burr St
- 203 Revis St
- 205 Revis St
- LOT 58 Belk St
- 119 Belk St
- LOT 65 Belk St
- LOT 66 Belk St
- 600,606,608,616 S Harlem
- 0 Baugh St Unit 2880088
- 0 Baugh St
- 204 Baugh St
- 201 Vine St
- 0 Gardner St Unit 8837605
- 0 Gardner St Unit 8274012
- 0 Gardner St Unit 7580075
- E Baugh St
- 203 Vine St
- 202 Gardner St
- 201 Baugh St
- 203 Baugh St
- 206 Baugh St
- 205 Vine St
- 108 Baugh St
- 108 Gardner St
- 202 Vine St
- 204 Gardner St
- 105 Gardenia Ln Unit 105B
- 105 Gardenia Ln Unit 105A