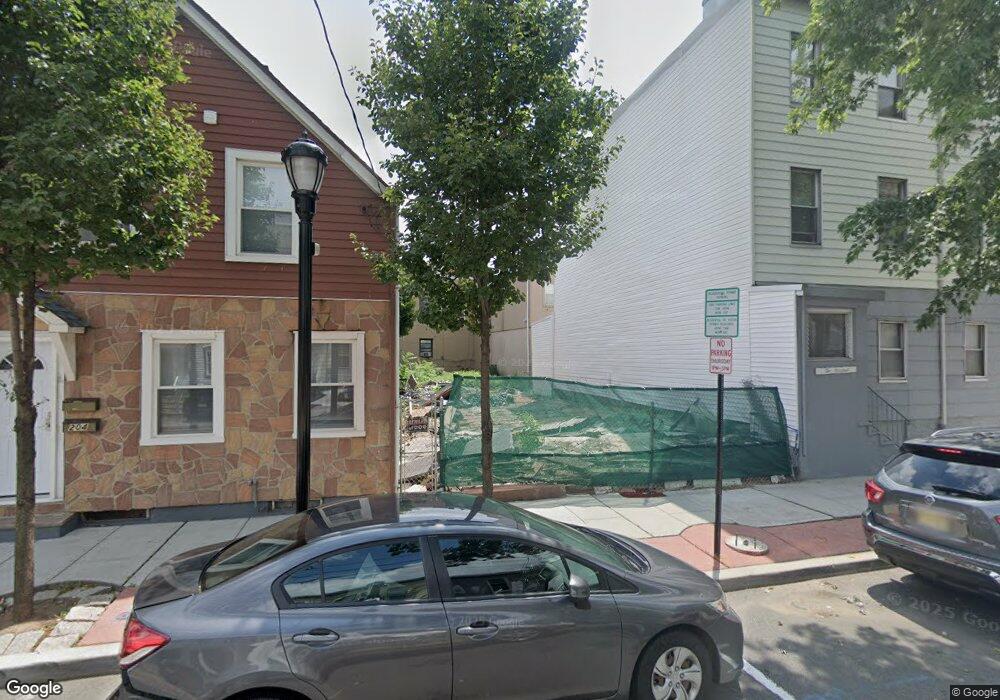
202 Bergenline Ave Union City, NJ 07087
Estimated Value: $476,000 - $735,054
7
Beds
3
Baths
2,600
Sq Ft
$233/Sq Ft
Est. Value
About This Home
This home is located at 202 Bergenline Ave, Union City, NJ 07087 and is currently estimated at $605,527, approximately $232 per square foot. 202 Bergenline Ave is a home located in Hudson County with nearby schools including Thomas A. Edison Elementary School, Sara M. Gilmore Academy, and Emerson Middle School.
Ownership History
Date
Name
Owned For
Owner Type
Purchase Details
Closed on
Jul 28, 2022
Sold by
Ssa Developments Ii Llc
Bought by
Ssa Developments Ii Llc
Current Estimated Value
Purchase Details
Closed on
Jul 27, 2018
Sold by
Mendez Jose
Bought by
Ssa Developments Ii Llc
Purchase Details
Closed on
Jun 9, 2007
Sold by
Vega Evelia and Otero Ana
Bought by
Mendez Jose and Otero Ana
Purchase Details
Closed on
Oct 6, 2005
Sold by
Rosado Carmelo and Rosado Anilda
Bought by
Vega Evelia and Otaro Ana
Home Financials for this Owner
Home Financials are based on the most recent Mortgage that was taken out on this home.
Original Mortgage
$81,450
Interest Rate
5.72%
Mortgage Type
Purchase Money Mortgage
Create a Home Valuation Report for This Property
The Home Valuation Report is an in-depth analysis detailing your home's value as well as a comparison with similar homes in the area
Home Values in the Area
Average Home Value in this Area
Purchase History
| Date | Buyer | Sale Price | Title Company |
|---|---|---|---|
| Ssa Developments Ii Llc | -- | -- | |
| Ssa Developments Ii Llc | -- | None Listed On Document | |
| Ssa Developments Ii Llc | $400,000 | Acres Land Title Agency Inc | |
| Mendez Jose | -- | None Available | |
| Vega Evelia | $90,500 | -- |
Source: Public Records
Mortgage History
| Date | Status | Borrower | Loan Amount |
|---|---|---|---|
| Previous Owner | Vega Evelia | $81,450 |
Source: Public Records
Tax History Compared to Growth
Tax History
| Year | Tax Paid | Tax Assessment Tax Assessment Total Assessment is a certain percentage of the fair market value that is determined by local assessors to be the total taxable value of land and additions on the property. | Land | Improvement |
|---|---|---|---|---|
| 2025 | $5,544 | $357,500 | $307,500 | $50,000 |
| 2024 | $11,394 | $300,000 | $300,000 | $0 |
| 2023 | $11,394 | $148,200 | $85,500 | $62,700 |
| 2022 | $10,983 | $148,200 | $85,500 | $62,700 |
| 2021 | $10,945 | $148,200 | $85,500 | $62,700 |
| 2020 | $10,820 | $148,200 | $85,500 | $62,700 |
| 2019 | $10,527 | $148,200 | $85,500 | $62,700 |
| 2018 | $10,330 | $148,200 | $85,500 | $62,700 |
| 2017 | $10,232 | $148,200 | $85,500 | $62,700 |
| 2016 | $10,211 | $148,200 | $85,500 | $62,700 |
| 2015 | $10,373 | $153,200 | $85,500 | $67,700 |
| 2014 | $10,148 | $153,200 | $85,500 | $67,700 |
Source: Public Records
Map
Nearby Homes
- 206 Bergenline Ave
- 419 3rd St
- 413 4th St
- 200 Paterson Plank Rd Unit 504
- 301 Palisade Ave Unit 6B
- 415 6th St
- 308 5th St
- 520 New York Ave Unit 2
- 414 6th St
- 605 New York Ave Unit 301
- 17 Leonard St Unit 3
- 17 Leonard St Unit 2
- 19 Leonard St
- 372 Webster Ave
- 517 7th St Unit 2C
- 302 6th St
- 500 Central Ave Unit 1605
- 500 Central Ave Unit 717
- 500 Central Ave Unit 1606
- 500 Central Ave Unit 1617
- 204 Bergenline Ave
- 204 Bergenline Ave Unit 2
- 200 Bergenline Ave Unit 3
- 200 Bergenline Ave Unit 2
- 200 Bergenline Ave Unit 5
- 200 Bergenline Ave Unit 4
- 200 Bergenline Ave
- 422 2nd St Unit 24
- 208 Bergenline Ave
- 420 2nd St
- 420 2nd St Unit 1
- 420 2nd St Unit 2
- 210 Bergenline Ave Unit 15
- 210 Bergenline Ave Unit 1
- 210 Bergenline Ave Unit 17
- 210 Bergenline Ave Unit 3
- 210 Bergenline Ave Unit 9
- 210 Bergenline Ave Unit 6
- 210 Bergenline Ave Unit 12
- 210 Bergenline Ave Unit 7