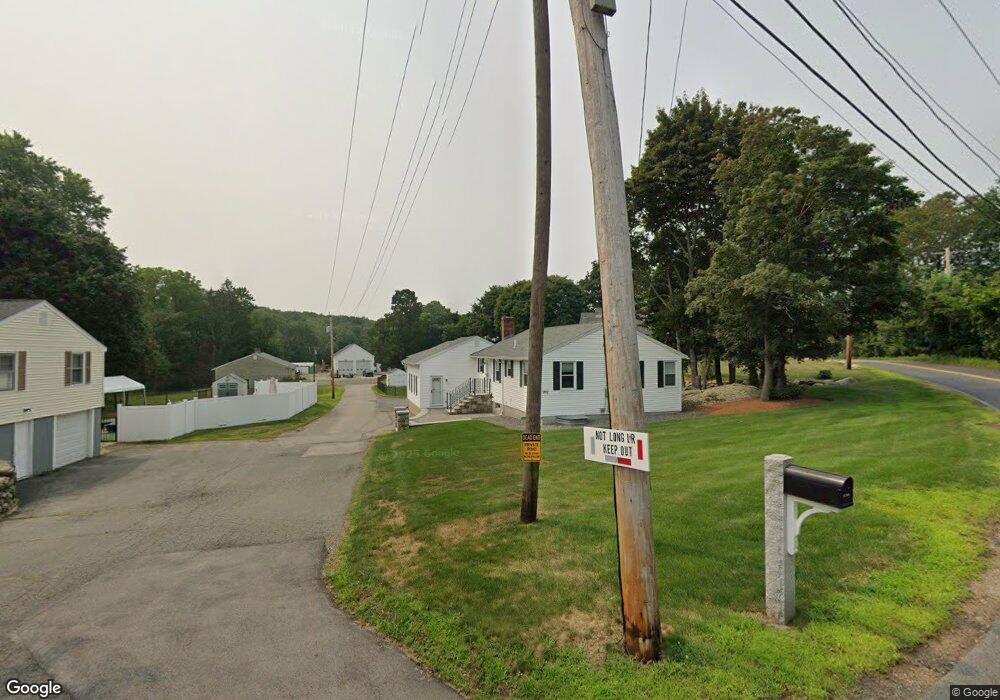
202 Berlin Rd Marlborough, MA 01752
French Hill NeighborhoodEstimated Value: $581,000 - $645,653
3
Beds
2
Baths
1,040
Sq Ft
$602/Sq Ft
Est. Value
About This Home
This home is located at 202 Berlin Rd, Marlborough, MA 01752 and is currently estimated at $626,163, approximately $602 per square foot. 202 Berlin Rd is a home located in Middlesex County with nearby schools including Marlborough High School, New Covenant Christian School, and Hillside School.
Ownership History
Date
Name
Owned For
Owner Type
Purchase Details
Closed on
Oct 19, 2022
Sold by
Hansen Christopher and Hansen Krystal
Bought by
Hansen Ft
Current Estimated Value
Purchase Details
Closed on
Nov 5, 2013
Sold by
Riani Olga V Est
Bought by
Hansen Christopher and Hansen Krystal L
Home Financials for this Owner
Home Financials are based on the most recent Mortgage that was taken out on this home.
Original Mortgage
$289,361
Interest Rate
4.62%
Mortgage Type
FHA
Purchase Details
Closed on
Apr 25, 2005
Sold by
Riani Michele A
Bought by
Riani Olga V
Create a Home Valuation Report for This Property
The Home Valuation Report is an in-depth analysis detailing your home's value as well as a comparison with similar homes in the area
Home Values in the Area
Average Home Value in this Area
Purchase History
| Date | Buyer | Sale Price | Title Company |
|---|---|---|---|
| Hansen Ft | -- | None Available | |
| Hansen Christopher | $285,000 | -- | |
| Riani Olga V | -- | -- |
Source: Public Records
Mortgage History
| Date | Status | Borrower | Loan Amount |
|---|---|---|---|
| Previous Owner | Hansen Christopher | $289,361 |
Source: Public Records
Tax History Compared to Growth
Tax History
| Year | Tax Paid | Tax Assessment Tax Assessment Total Assessment is a certain percentage of the fair market value that is determined by local assessors to be the total taxable value of land and additions on the property. | Land | Improvement |
|---|---|---|---|---|
| 2025 | $5,809 | $589,100 | $244,800 | $344,300 |
| 2024 | $5,632 | $550,000 | $223,000 | $327,000 |
| 2023 | $5,749 | $498,200 | $193,800 | $304,400 |
| 2022 | $5,374 | $409,600 | $185,100 | $224,500 |
| 2021 | $5,455 | $395,300 | $155,500 | $239,800 |
| 2020 | $5,415 | $381,900 | $148,500 | $233,400 |
| 2019 | $5,314 | $377,700 | $145,900 | $231,800 |
| 2018 | $5,066 | $346,300 | $132,000 | $214,300 |
| 2017 | $4,876 | $318,300 | $134,200 | $184,100 |
| 2016 | $4,739 | $308,900 | $134,200 | $174,700 |
| 2015 | $5,540 | $351,500 | $138,100 | $213,400 |
Source: Public Records
Map
Nearby Homes