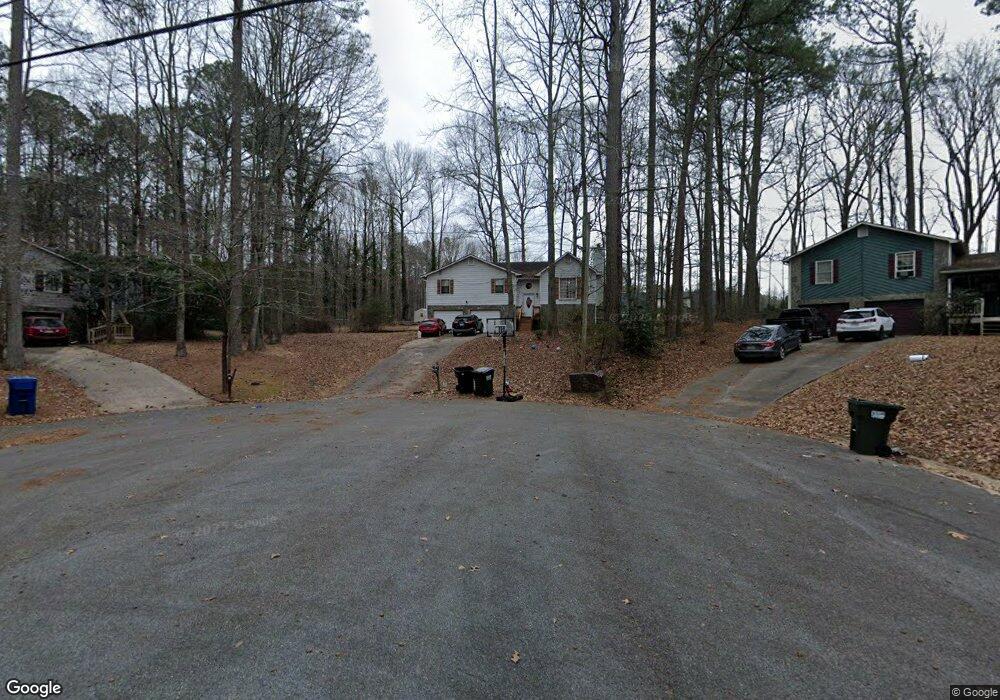
202 Blackhawk Trail Dallas, GA 30157
East Paulding County NeighborhoodEstimated Value: $257,000 - $299,000
3
Beds
2
Baths
1,260
Sq Ft
$221/Sq Ft
Est. Value
About This Home
This home is located at 202 Blackhawk Trail, Dallas, GA 30157 and is currently estimated at $278,628, approximately $221 per square foot. 202 Blackhawk Trail is a home located in Paulding County with nearby schools including C. A. Roberts Elementary School, East Paulding Middle School, and East Paulding High School.
Ownership History
Date
Name
Owned For
Owner Type
Purchase Details
Closed on
Jul 17, 2020
Sold by
Nason Jeremy B
Bought by
Bishop Zachary Lee
Current Estimated Value
Home Financials for this Owner
Home Financials are based on the most recent Mortgage that was taken out on this home.
Original Mortgage
$176,641
Outstanding Balance
$156,634
Interest Rate
3.1%
Mortgage Type
FHA
Estimated Equity
$121,994
Purchase Details
Closed on
Jul 10, 2006
Sold by
Nason Jeremy B
Bought by
Nason Jeremy B
Home Financials for this Owner
Home Financials are based on the most recent Mortgage that was taken out on this home.
Original Mortgage
$107,800
Interest Rate
1%
Mortgage Type
Stand Alone Second
Purchase Details
Closed on
May 16, 2005
Sold by
Jett Robin O and Jett Russell
Bought by
Nason Jeremy B
Home Financials for this Owner
Home Financials are based on the most recent Mortgage that was taken out on this home.
Original Mortgage
$118,146
Interest Rate
5.74%
Mortgage Type
VA
Create a Home Valuation Report for This Property
The Home Valuation Report is an in-depth analysis detailing your home's value as well as a comparison with similar homes in the area
Home Values in the Area
Average Home Value in this Area
Purchase History
| Date | Buyer | Sale Price | Title Company |
|---|---|---|---|
| Bishop Zachary Lee | $179,900 | -- | |
| Nason Jeremy B | -- | -- | |
| Nason Jeremy B | $124,900 | -- |
Source: Public Records
Mortgage History
| Date | Status | Borrower | Loan Amount |
|---|---|---|---|
| Open | Bishop Zachary Lee | $176,641 | |
| Previous Owner | Nason Jeremy B | $107,800 | |
| Previous Owner | Nason Jeremy B | $20,000 | |
| Previous Owner | Nason Jeremy B | $118,146 |
Source: Public Records
Tax History Compared to Growth
Tax History
| Year | Tax Paid | Tax Assessment Tax Assessment Total Assessment is a certain percentage of the fair market value that is determined by local assessors to be the total taxable value of land and additions on the property. | Land | Improvement |
|---|---|---|---|---|
| 2024 | $2,453 | $101,844 | $12,000 | $89,844 |
| 2023 | $2,244 | $88,596 | $12,000 | $76,596 |
| 2022 | $2,379 | $80,092 | $12,000 | $68,092 |
| 2021 | $1,780 | $59,948 | $10,000 | $49,948 |
| 2020 | $1,812 | $61,008 | $10,000 | $51,008 |
| 2019 | $1,613 | $53,520 | $10,000 | $43,520 |
| 2016 | $1,093 | $38,024 | $10,000 | $28,024 |
| 2015 | $908 | $31,372 | $10,000 | $21,372 |
| 2014 | $865 | $29,276 | $10,000 | $19,276 |
| 2013 | -- | $18,080 | $6,000 | $12,080 |
Source: Public Records
Map
Nearby Homes
- 1846 Bobo Rd
- 364 Dublin Way
- 150 Azalea Lakes Ct
- Oconee Plan at Mount Tabor Pointe
- Tybee Plan at Mount Tabor Pointe
- Lanier Plan at Mount Tabor Pointe
- Juliette Plan at Mount Tabor Pointe
- Rabun Plan at Mount Tabor Pointe
- Davenport Plan at Mount Tabor Pointe
- 354 Dublin Way
- 384 Dublin Way
- 318 Dublin Way
- 375 Dublin Way
- 406 Dublin Way
- 395 Dublin Way
- 292 Dublin Way
- 443 Dublin Way
- 74 Dew Drop Ln
- 116 Gail St
- 255 Dublin Way
- 196 Blackhawk Trail
- 212 Blackhawk Trail
- 166 Blackhawk Trail
- 199 Blackhawk Trail
- 185 Blackhawk Trail
- 146 Blackhawk Trail
- 167 Blackhawk Trail
- 127 Blackhawk Trail
- 132 Blackhawk Trail
- 80 Etowah Ct Unit 31
- 80 Etowah Ct
- 2065 Bobo Rd
- 81 Etowah Ct
- 2101 Bobo Rd
- 118 Blackhawk Trail
- 72 Etowah Ct
- 72 Etowah Ct
- 99 Blackhawk Trail
- 73 Etowah Ct
- 112 Blackhawk Trail