Estimated Value: $390,000 - $437,000
3
Beds
3
Baths
2,848
Sq Ft
$146/Sq Ft
Est. Value
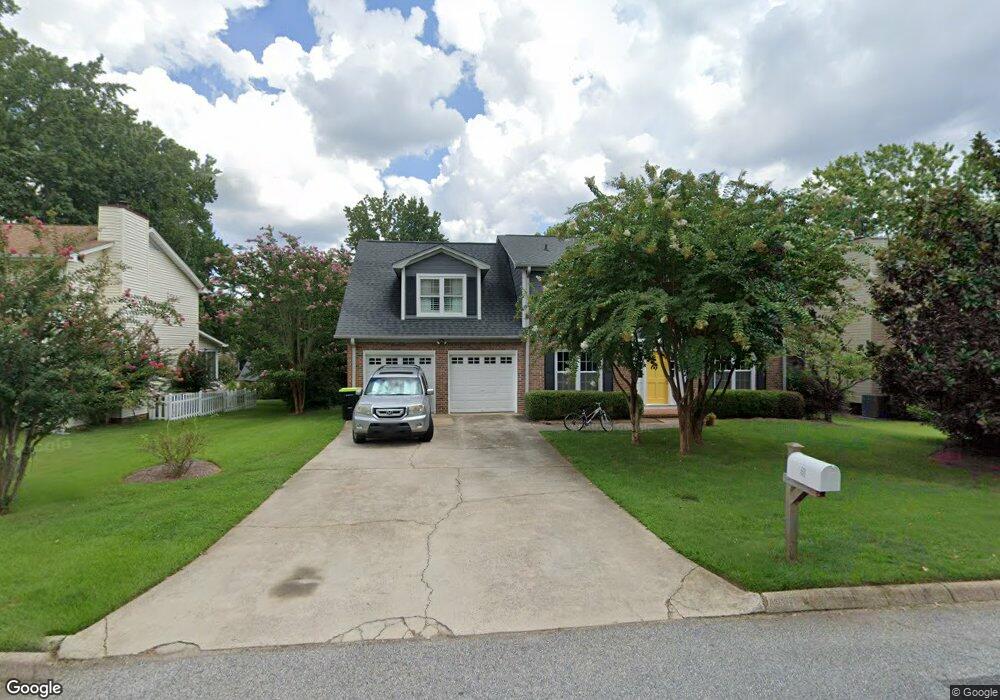
About This Home
This home is located at 202 Bloomfield Ln, Greer, SC 29650 and is currently estimated at $416,379, approximately $146 per square foot. 202 Bloomfield Ln is a home located in Greenville County with nearby schools including Pelham Road Elementary School, Greenville Middle Academy, and Eastside High School.
Ownership History
Date
Name
Owned For
Owner Type
Purchase Details
Closed on
Sep 29, 2014
Sold by
Douglass Joel M
Bought by
Pasek Jon D and Pasek Ann Marie
Current Estimated Value
Home Financials for this Owner
Home Financials are based on the most recent Mortgage that was taken out on this home.
Original Mortgage
$136,000
Outstanding Balance
$41,412
Interest Rate
4.15%
Mortgage Type
New Conventional
Estimated Equity
$374,967
Purchase Details
Closed on
Jun 17, 2011
Sold by
Brown John M and Brown Caroline Q
Bought by
Douglass Joel M
Home Financials for this Owner
Home Financials are based on the most recent Mortgage that was taken out on this home.
Original Mortgage
$143,366
Interest Rate
4.71%
Mortgage Type
New Conventional
Purchase Details
Closed on
Oct 6, 2004
Sold by
Long Daniel R
Bought by
Brown Caroline Q
Purchase Details
Closed on
Sep 29, 2004
Sold by
Long Daniel R
Bought by
Brown Caroline Q
Create a Home Valuation Report for This Property
The Home Valuation Report is an in-depth analysis detailing your home's value as well as a comparison with similar homes in the area
Home Values in the Area
Average Home Value in this Area
Purchase History
| Date | Buyer | Sale Price | Title Company |
|---|---|---|---|
| Pasek Jon D | $170,000 | -- | |
| Douglass Joel M | $147,800 | -- | |
| Brown Caroline Q | $146,000 | -- | |
| Brown Caroline Q | $146,000 | -- |
Source: Public Records
Mortgage History
| Date | Status | Borrower | Loan Amount |
|---|---|---|---|
| Open | Pasek Jon D | $136,000 | |
| Previous Owner | Douglass Joel M | $143,366 |
Source: Public Records
Tax History
| Year | Tax Paid | Tax Assessment Tax Assessment Total Assessment is a certain percentage of the fair market value that is determined by local assessors to be the total taxable value of land and additions on the property. | Land | Improvement |
|---|---|---|---|---|
| 2025 | $1,302 | $8,310 | $1,770 | $6,540 |
| 2024 | $1,302 | $7,220 | $1,240 | $5,980 |
| 2023 | $1,255 | $7,220 | $1,240 | $5,980 |
| 2022 | $1,167 | $7,220 | $1,240 | $5,980 |
| 2021 | $1,168 | $7,220 | $1,240 | $5,980 |
| 2020 | $1,092 | $6,280 | $1,080 | $5,200 |
| 2019 | $1,073 | $6,280 | $1,080 | $5,200 |
| 2018 | $1,152 | $6,280 | $1,080 | $5,200 |
| 2017 | $1,143 | $6,280 | $1,080 | $5,200 |
| 2016 | $1,090 | $157,110 | $27,000 | $130,110 |
| 2015 | $1,077 | $157,110 | $27,000 | $130,110 |
| 2014 | $1,071 | $157,110 | $27,000 | $130,110 |
Source: Public Records
Map
Nearby Homes
- 100 Bridle Way
- 128 Paddock Dr
- 107 Longstreet Dr
- 205 Longstreet Dr
- 209 Governors Square
- 301 Rosebud Ln
- 100 Terrence Ct
- 103 Downing Place
- 323 Majesty Ct
- 322 Majesty Ct
- 206 Carolena Rose Way
- 703 Hedgewood Terrace
- 17 Thurlow Ct
- 3 Hibourne Ct
- 7 Pelham Crossing Dr
- 5 Pelham Crossing Dr
- 6 Pelham Crossing Dr
- 1016 Old Boiling Springs Rd
- 9 Suffolk Downs Way
- 639 Ponden Dr
- 204 Bloomfield Ln
- 200 Bloomfield Ln
- 418 Longstreet Dr
- 206 Bloomfield Ln
- 104 Bloomfield Ln
- 416 Longstreet Dr
- 420 Longstreet Dr
- 201 Bloomfield Ln
- 203 Bloomfield Ln
- 414 Longstreet Dr
- 205 Bloomfield Ln
- 208 Bloomfield Ln
- 102 Bloomfield Ln
- 101 Leeward Terrace
- 207 Bloomfield Ln
- 412 Longstreet Dr
- 422 Longstreet Dr
- 104 Leeward Terrace
- 210 Bloomfield Ln
- 103 Leeward Terrace
Your Personal Tour Guide
Ask me questions while you tour the home.