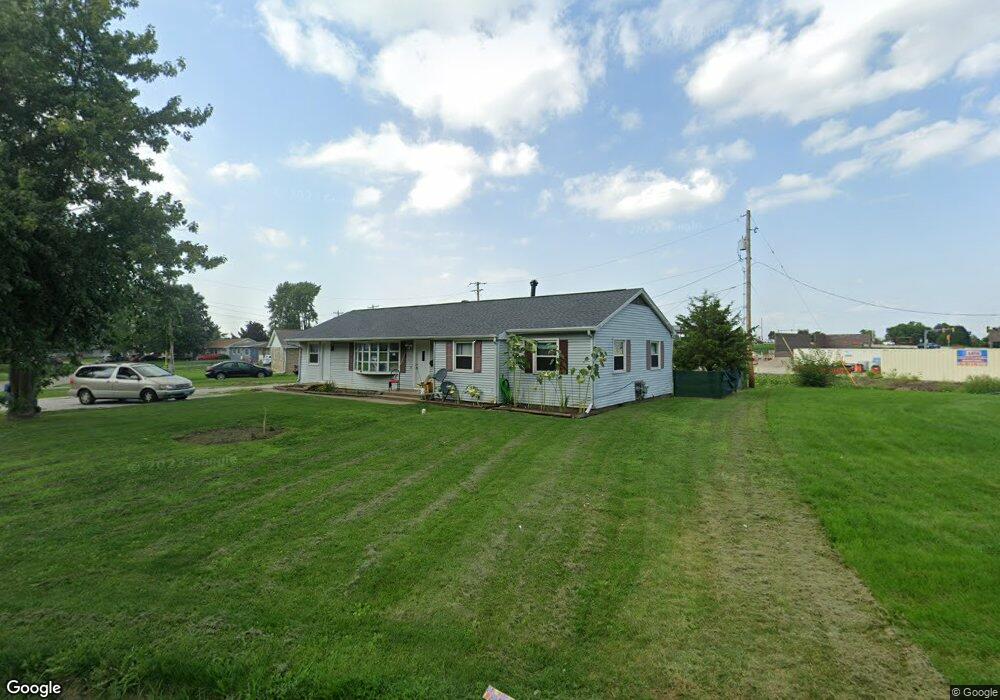
202 Briar Ln Champaign, IL 61820
Garden Park NeighborhoodEstimated Value: $111,000 - $134,000
About This Home
This home is located at 202 Briar Ln, Champaign, IL 61820 and is currently estimated at $122,877, approximately $83 per square foot. 202 Briar Ln is a home located in Champaign County with nearby schools including Central High School and Franklin STEAM Academy.
Ownership History
We collect this data history from publicly available records. To have your information removed, we recommend requesting removal directly through your county’s website.
Purchase Details
Home Financials for this Owner
Home Financials are based on the most recent Mortgage that was taken out on this home.Purchase Details
Purchase Details
Home Values in the Area
Average Home Value in this Area
Purchase History
We collect this data history from publicly available records. To have your information removed, we recommend requesting removal directly through your county’s website.
| Date | Buyer | Sale Price | Title Company |
|---|---|---|---|
| $78,500 | Attorney | ||
| -- | -- | ||
| -- | -- |
Mortgage History
We collect this data history from publicly available records. To have your information removed, we recommend requesting removal directly through your county’s website.
| Date | Status | Borrower | Loan Amount |
|---|---|---|---|
| Open | $75,878 |
Tax History
We collect this data history from publicly available records. To have your information removed, we recommend requesting removal directly through your county’s website.
| Year | Tax Paid | Tax Assessment Tax Assessment Total Assessment is a certain percentage of the fair market value that is determined by local assessors to be the total taxable value of land and additions on the property. | Land | Improvement |
|---|---|---|---|---|
| 2025 | $2,048 | $33,080 | $8,530 | $24,550 |
| 2024 | $1,880 | $29,480 | $7,600 | $21,880 |
| 2023 | $1,880 | $26,850 | $6,920 | $19,930 |
| 2022 | $1,726 | $24,770 | $6,380 | $18,390 |
| 2021 | $1,673 | $24,280 | $6,250 | $18,030 |
| 2020 | $1,733 | $24,900 | $6,410 | $18,490 |
| 2019 | $1,666 | $24,390 | $6,280 | $18,110 |
| 2018 | $1,620 | $24,000 | $6,180 | $17,820 |
| 2017 | $1,627 | $24,000 | $6,180 | $17,820 |
| 2016 | $1,448 | $23,500 | $6,050 | $17,450 |
| 2015 | $1,449 | $23,080 | $5,940 | $17,140 |
| 2014 | $1,437 | $23,080 | $5,940 | $17,140 |
| 2013 | $1,424 | $23,080 | $5,940 | $17,140 |
Map
- 218 Arcadia Dr
- 1407 N Walnut St
- LOT 202 of Atkins We Bloomington Rd
- 1202 N Champaign St
- 911 N Elm St
- 111 Petry Ct
- 403 W Columbia Ave
- 1009 N Prospect Ave
- 503 E Bradley Ave
- 410 N State St Unit 4
- 408 N State St Unit 12
- 406 N Prairie St Unit 10
- 1 E Main St Unit 404
- 301 N Neil St Unit 808-809
- 301 N Neil St Unit 711
- 301 N Neil St Unit 608
- 412 E Columbia Ave
- 212 E Hill St
- 1205 Gertrude Ave
- 613 W Church St
Ask me questions while you tour the home.