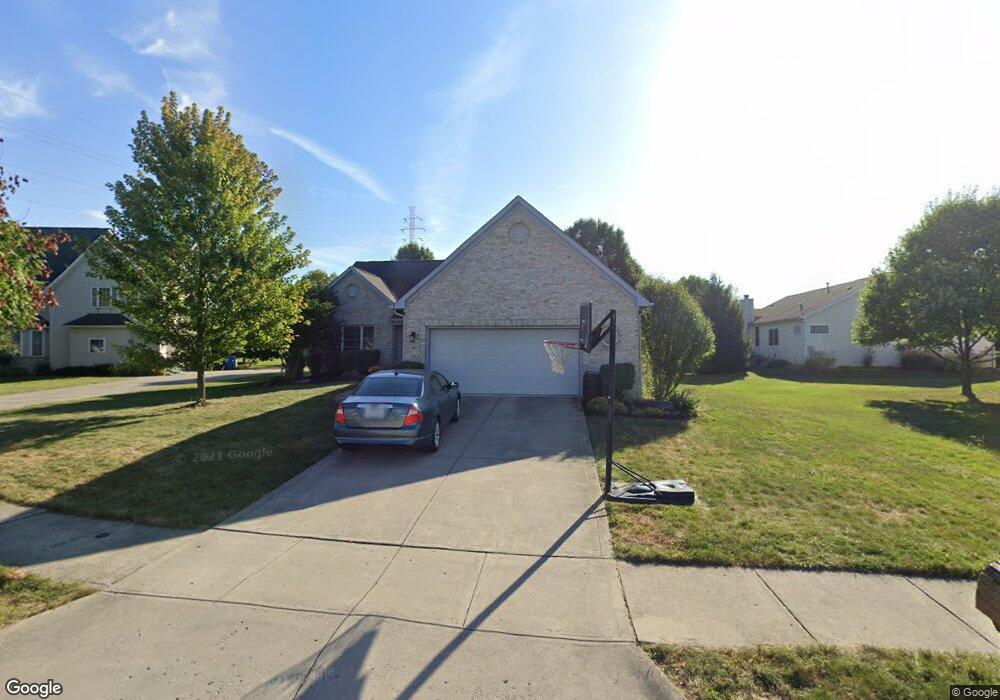
202 Briarwood Ct Westerville, OH 43081
Estimated Value: $426,045 - $473,000
3
Beds
2
Baths
1,756
Sq Ft
$255/Sq Ft
Est. Value
About This Home
This home is located at 202 Briarwood Ct, Westerville, OH 43081 and is currently estimated at $447,511, approximately $254 per square foot. 202 Briarwood Ct is a home located in Franklin County with nearby schools including Mark Twain Elementary School, Walnut Springs Middle School, and Westerville-North High School.
Ownership History
Date
Name
Owned For
Owner Type
Purchase Details
Closed on
Nov 9, 2016
Sold by
Bohan Michelle L
Bought by
Knoblauch Deanne E
Current Estimated Value
Home Financials for this Owner
Home Financials are based on the most recent Mortgage that was taken out on this home.
Original Mortgage
$170,000
Outstanding Balance
$136,481
Interest Rate
3.42%
Mortgage Type
New Conventional
Estimated Equity
$311,030
Purchase Details
Closed on
Jul 25, 2001
Sold by
Haines Tim C and Haines Marjorie L
Bought by
Bohan Michelle L and Knoblauch Deanne E
Home Financials for this Owner
Home Financials are based on the most recent Mortgage that was taken out on this home.
Original Mortgage
$201,400
Interest Rate
7.15%
Mortgage Type
Purchase Money Mortgage
Purchase Details
Closed on
Nov 15, 2000
Sold by
W & K Development Ltd
Bought by
Haines Tim C and Haines Marjorie L
Create a Home Valuation Report for This Property
The Home Valuation Report is an in-depth analysis detailing your home's value as well as a comparison with similar homes in the area
Home Values in the Area
Average Home Value in this Area
Purchase History
| Date | Buyer | Sale Price | Title Company |
|---|---|---|---|
| Knoblauch Deanne E | $103,700 | Expedient Title | |
| Bohan Michelle L | $212,000 | Title First Agency Inc | |
| Haines Tim C | $44,000 | Stewart Title Agency Of Ohio |
Source: Public Records
Mortgage History
| Date | Status | Borrower | Loan Amount |
|---|---|---|---|
| Open | Knoblauch Deanne E | $170,000 | |
| Previous Owner | Bohan Michelle L | $201,400 |
Source: Public Records
Tax History Compared to Growth
Tax History
| Year | Tax Paid | Tax Assessment Tax Assessment Total Assessment is a certain percentage of the fair market value that is determined by local assessors to be the total taxable value of land and additions on the property. | Land | Improvement |
|---|---|---|---|---|
| 2024 | $7,406 | $130,310 | $35,000 | $95,310 |
| 2023 | $7,249 | $130,305 | $35,000 | $95,305 |
| 2022 | $6,653 | $91,320 | $21,000 | $70,320 |
| 2021 | $6,709 | $91,320 | $21,000 | $70,320 |
| 2020 | $6,690 | $91,320 | $21,000 | $70,320 |
| 2019 | $5,861 | $75,530 | $17,500 | $58,030 |
| 2018 | $5,820 | $75,530 | $17,500 | $58,030 |
| 2017 | $5,925 | $75,530 | $17,500 | $58,030 |
| 2016 | $6,086 | $72,590 | $24,290 | $48,300 |
| 2015 | $5,894 | $72,590 | $24,290 | $48,300 |
| 2014 | $5,899 | $72,590 | $24,290 | $48,300 |
| 2013 | $2,805 | $69,125 | $23,135 | $45,990 |
Source: Public Records
Map
Nearby Homes
- 73 Keethler Dr S
- 1155 Ashford Ct
- 974 Lakeland Dr
- 912 Lakeway Ct E
- 90 Spring Creek Dr
- 8369 Manitou Dr
- 768 Collingwood Dr
- 718 Sugar Ct
- 192 Buckeye Ct
- 4485 Smothers Rd
- 969 Farrington Dr
- 1368 Nutmeg Ct
- 200 Matthew Ave
- 589 E College Ave
- 656 Olde Mill Dr
- 150 Matthew Ave
- 9119 Robinhood Cir
- 182 Hillcrest Dr
- 7568 Park Bend Ct
- 613 Valley Wood Ct
- 206 Briarwood Ct
- 1236 Oakwood Ln
- 181 Oakwood Ct
- 191 Oakwood Ct
- 201 Oakwood Ct
- 199 Briarwood Ct
- 1220 Oakwood Ln
- 211 Oakwood Ct
- 210 Briarwood Ct
- 207 Briarwood Ct
- 215 Briarwood Ct
- 1210 Oakwood Ln
- 1234 Springtree Ln
- 219 Oakwood Ct
- 200 Oak Tree Ct
- 1221 Oakwood Ln
- 174 Oakwood Ct
- 208 Oak Tree Ct
- 192 Oakwood Ct
- 186 Oakwood Ct