Estimated Value: $371,174 - $408,000
5
Beds
3
Baths
2,941
Sq Ft
$132/Sq Ft
Est. Value
About This Home
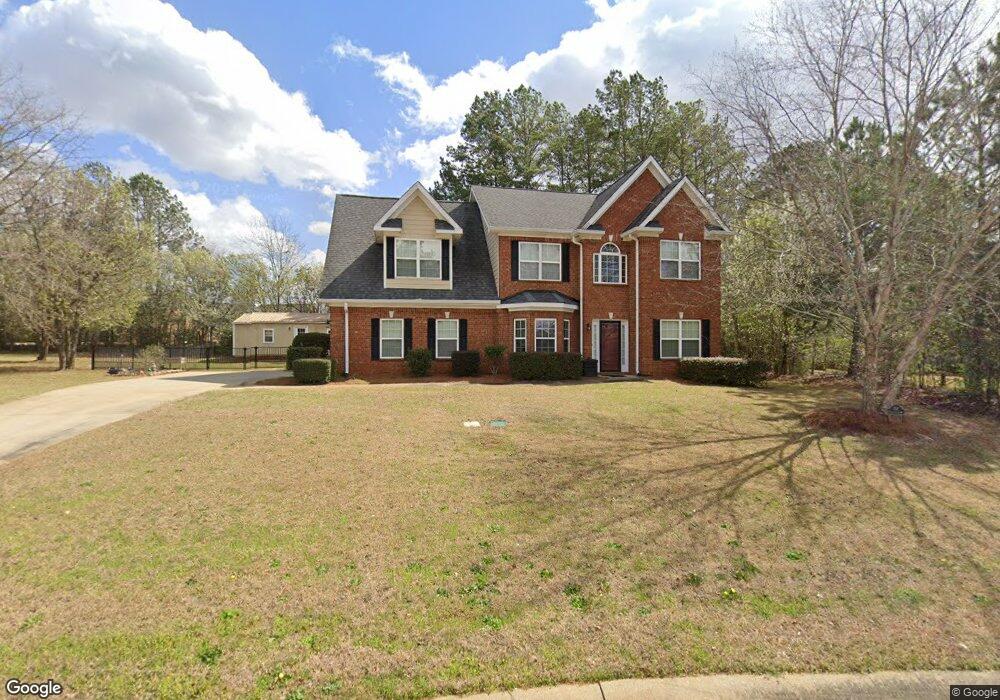
This home is located at 202 Bridgehampton Way, Perry, GA 31069 and is currently estimated at $389,044, approximately $132 per square foot. 202 Bridgehampton Way is a home located in Houston County with nearby schools including Morningside Elementary School, Perry Middle School, and Perry High School.
Ownership History
Date
Name
Owned For
Owner Type
Purchase Details
Closed on
Nov 20, 2020
Sold by
Buckles Monica
Bought by
Salo John Michael
Current Estimated Value
Home Financials for this Owner
Home Financials are based on the most recent Mortgage that was taken out on this home.
Original Mortgage
$288,008
Outstanding Balance
$253,345
Interest Rate
2.8%
Mortgage Type
VA
Estimated Equity
$135,699
Purchase Details
Closed on
Jun 29, 2006
Sold by
Choice Homes Inc
Bought by
Buckles Monica M
Home Financials for this Owner
Home Financials are based on the most recent Mortgage that was taken out on this home.
Original Mortgage
$182,036
Interest Rate
8.12%
Mortgage Type
New Conventional
Purchase Details
Closed on
Oct 25, 2005
Sold by
North Hamptons Llc
Bought by
Choice Homes Inc
Create a Home Valuation Report for This Property
The Home Valuation Report is an in-depth analysis detailing your home's value as well as a comparison with similar homes in the area
Home Values in the Area
Average Home Value in this Area
Purchase History
| Date | Buyer | Sale Price | Title Company |
|---|---|---|---|
| Salo John Michael | $278,000 | None Available | |
| Buckles Monica M | $227,600 | None Available | |
| Choice Homes Inc | $35,800 | -- |
Source: Public Records
Mortgage History
| Date | Status | Borrower | Loan Amount |
|---|---|---|---|
| Open | Salo John Michael | $288,008 | |
| Previous Owner | Buckles Monica M | $182,036 | |
| Previous Owner | Buckles Monica M | $45,500 |
Source: Public Records
Tax History
| Year | Tax Paid | Tax Assessment Tax Assessment Total Assessment is a certain percentage of the fair market value that is determined by local assessors to be the total taxable value of land and additions on the property. | Land | Improvement |
|---|---|---|---|---|
| 2025 | $4,576 | $147,440 | $12,800 | $134,640 |
| 2024 | $4,974 | $136,600 | $12,800 | $123,800 |
| 2023 | $4,461 | $121,840 | $12,800 | $109,040 |
| 2022 | $2,520 | $111,600 | $12,800 | $98,800 |
| 2021 | $2,312 | $102,000 | $12,800 | $89,200 |
| 2020 | $30 | $91,640 | $12,800 | $78,840 |
| 2019 | $139 | $91,640 | $12,800 | $78,840 |
| 2018 | $245 | $91,640 | $12,800 | $78,840 |
| 2017 | $333 | $91,640 | $12,800 | $78,840 |
| 2016 | $416 | $91,640 | $12,800 | $78,840 |
| 2015 | $2,001 | $85,720 | $12,800 | $72,920 |
| 2014 | -- | $85,720 | $12,800 | $72,920 |
| 2013 | -- | $85,720 | $12,800 | $72,920 |
Source: Public Records
Map
Nearby Homes
- 1802 Houston Lake Rd
- 112 Bainbridge Ln
- 1312 Keith Dr
- 1729 Milton Way
- 102 N Haven Ln
- 138 Sadie Heights Blvd
- 135 Sadie Heights Blvd
- 137 Sadie Heights Blvd
- 105 Eagles Ridge Ct
- 207 Ensemble Blvd
- 110 Palmetto Ave
- 1304 Davis Ave
- 113 Billboard Ave
- 111 Billboard Ave
- 109 Billboard Ave
- 116 Prospect Ave
- 107 Billboard Ave
- 1703 Sewell Cir
- 111 Prospect Ave
- 109 Prospect Ave
- 200 Bridgehampton Way
- 204 Bridgehampton Way
- 100 Bainbridge Ln
- 104 Bridgehampton Way
- 206 Bridgehampton Way
- 203 Bridgehampton Way
- 102 Bainbridge Ln
- 102 Bridgehampton Way
- 208 Bridgehampton Way
- 205 Bridgehampton Way
- 103 Wainscott Ct
- 104 Bainbridge Ln
- 300 Bridgehampton Way
- 1803 Houston Lake Rd
- 104 N Hamptons Place
- 102 N Hamptons Place
- 200 N Hamptons Place
- 100 Wainscott Ct
- 5.73 AC Houston Lake Gray Rd
- 106 Bainbridge Ln
Your Personal Tour Guide
Ask me questions while you tour the home.