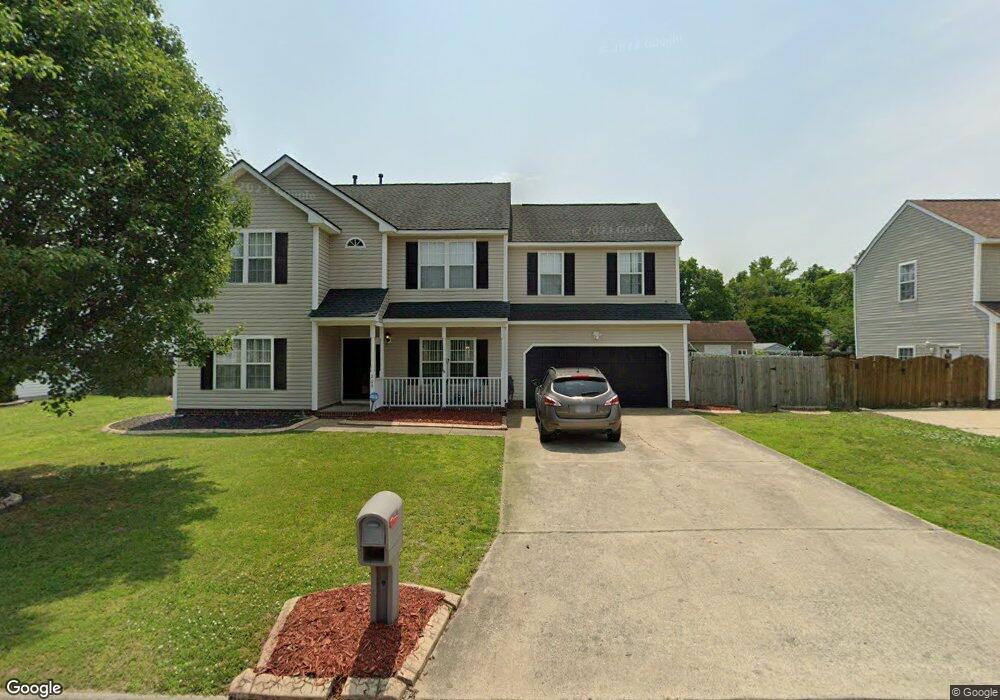
202 Chenango Crescent Suffolk, VA 23434
Chuckatuck NeighborhoodEstimated Value: $397,475 - $419,000
4
Beds
3
Baths
2,222
Sq Ft
$182/Sq Ft
Est. Value
About This Home
This home is located at 202 Chenango Crescent, Suffolk, VA 23434 and is currently estimated at $404,869, approximately $182 per square foot. 202 Chenango Crescent is a home located in Suffolk City with nearby schools including Hillpoint Elementary School, King's Fork Middle School, and King's Fork High School.
Ownership History
Date
Name
Owned For
Owner Type
Purchase Details
Closed on
Oct 30, 2020
Sold by
Venable Kenneth L and Venable Rosalyn T
Bought by
Lewis Tracy V
Current Estimated Value
Home Financials for this Owner
Home Financials are based on the most recent Mortgage that was taken out on this home.
Original Mortgage
$115,500
Outstanding Balance
$102,073
Interest Rate
2.8%
Mortgage Type
New Conventional
Estimated Equity
$302,796
Create a Home Valuation Report for This Property
The Home Valuation Report is an in-depth analysis detailing your home's value as well as a comparison with similar homes in the area
Home Values in the Area
Average Home Value in this Area
Purchase History
| Date | Buyer | Sale Price | Title Company |
|---|---|---|---|
| Lewis Tracy V | $290,500 | Attorney |
Source: Public Records
Mortgage History
| Date | Status | Borrower | Loan Amount |
|---|---|---|---|
| Open | Lewis Tracy V | $115,500 |
Source: Public Records
Tax History
| Year | Tax Paid | Tax Assessment Tax Assessment Total Assessment is a certain percentage of the fair market value that is determined by local assessors to be the total taxable value of land and additions on the property. | Land | Improvement |
|---|---|---|---|---|
| 2025 | $4,244 | $354,600 | $85,000 | $269,600 |
| 2024 | $4,244 | $360,800 | $85,000 | $275,800 |
| 2023 | $4,254 | $343,800 | $85,000 | $258,800 |
| 2022 | $3,370 | $309,200 | $85,000 | $224,200 |
| 2021 | $2,947 | $265,500 | $63,400 | $202,100 |
| 2020 | $2,866 | $258,200 | $63,400 | $194,800 |
| 2019 | $2,792 | $251,500 | $63,400 | $188,100 |
| 2018 | $2,742 | $245,300 | $63,400 | $181,900 |
| 2017 | $2,625 | $245,300 | $63,400 | $181,900 |
| 2016 | $2,480 | $231,800 | $63,400 | $168,400 |
| 2015 | $1,245 | $232,800 | $63,400 | $169,400 |
| 2014 | $1,245 | $232,800 | $63,400 | $169,400 |
Source: Public Records
Map
Nearby Homes
- 229 Burnetts Way
- 213 Burnetts Way
- 110 Timberneck Arch
- 112 Toddsbury Ct
- 149 Kristen Ln
- 137 Kristen Ln
- 210 Waterwood Way
- 112 Pippin Dr
- 211 Misty Ridge Ln
- 105 Dodge Ct
- 111 Windsor Ct
- 123 Lakes Edge Dr
- 108 Brassy St
- 110 Jordan Ave
- 144 Ashford Dr
- 304 Edward Ave
- 1328 River Rd
- 1231 Exchange Rd
- 152 Ashford Dr
- 134 Wexford Dr E
- 204 Chenango Crescent
- 200 Chenango Crescent
- 227 Jonathans Way
- 225 Jonathans Way
- 206 Chenango Crescent
- 229 Jonathans Way
- 203 Chenango Crescent
- 205 Chenango Crescent
- 201 Chenango Crescent
- 231 Jonathans Way
- 101 Chenango Ct
- 207 Chenango Crescent
- 208 Chenango Crescent
- 223 Jonathans Way
- 220 Jonathans Way
- 218 Jonathans Way
- 206 Fallawater Way
- 100 Chenango Ct
- 233 Jonathans Way
- 208 Fallawater Way
Your Personal Tour Guide
Ask me questions while you tour the home.