202 Cherry Ln Washington, IL 61571
Sunnyland NeighborhoodEstimated Value: $111,000 - $122,000
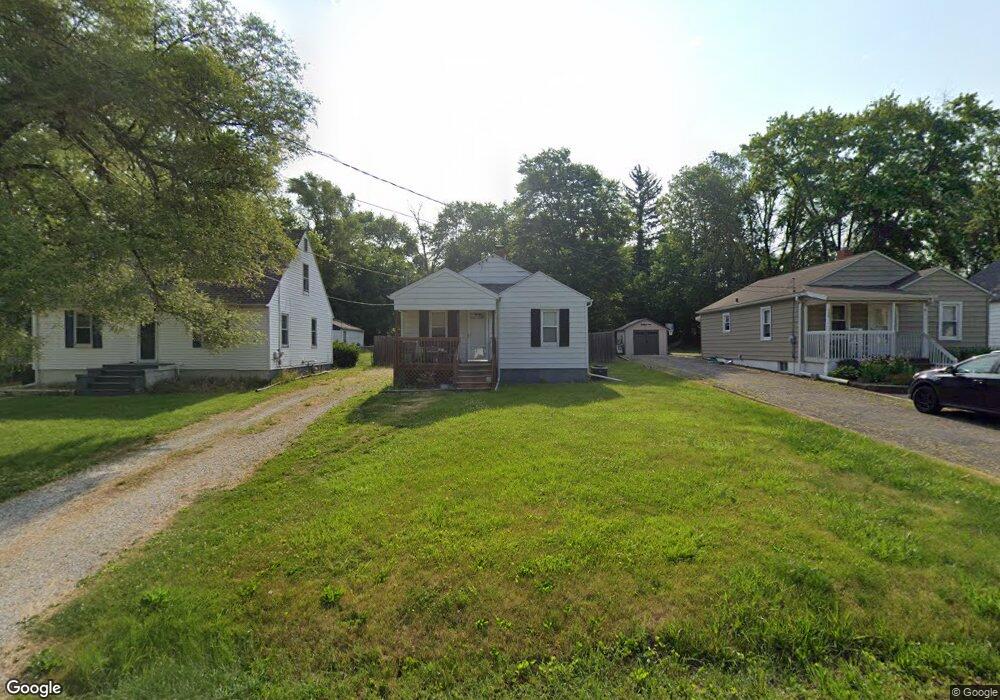
About This Home
This home is located at 202 Cherry Ln, Washington, IL 61571 and is currently estimated at $117,180, approximately $143 per square foot. 202 Cherry Ln is a home located in Tazewell County with nearby schools including J L Hensey Elementary School, Beverly Manor Elementary School, and Washington Community High School.
Ownership History
We collect this data history from publicly available records. To have your information removed, we recommend requesting removal directly through your county’s website.
Purchase Details
Home Financials for this Owner
Home Financials are based on the most recent Mortgage that was taken out on this home.Purchase Details
Home Financials for this Owner
Home Financials are based on the most recent Mortgage that was taken out on this home.Home Values in the Area
Average Home Value in this Area
Purchase History
We collect this data history from publicly available records. To have your information removed, we recommend requesting removal directly through your county’s website.
| Date | Buyer | Sale Price | Title Company |
|---|---|---|---|
| $77,000 | Hometown Title Inc | ||
| $30,000 | None Available |
Mortgage History
We collect this data history from publicly available records. To have your information removed, we recommend requesting removal directly through your county’s website.
| Date | Status | Borrower | Loan Amount |
|---|---|---|---|
| Open | $75,605 | ||
| Previous Owner | $40,000 |
Tax History
We collect this data history from publicly available records. To have your information removed, we recommend requesting removal directly through your county’s website.
| Year | Tax Paid | Tax Assessment Tax Assessment Total Assessment is a certain percentage of the fair market value that is determined by local assessors to be the total taxable value of land and additions on the property. | Land | Improvement |
|---|---|---|---|---|
| 2025 | $2,461 | $33,930 | $6,300 | $27,630 |
| 2024 | $2,296 | $30,980 | $5,750 | $25,230 |
| 2023 | $2,296 | $28,740 | $5,330 | $23,410 |
| 2022 | $2,197 | $26,850 | $4,980 | $21,870 |
| 2021 | $2,110 | $26,190 | $4,860 | $21,330 |
| 2020 | $2,104 | $26,190 | $4,860 | $21,330 |
| 2019 | $2,067 | $26,190 | $4,860 | $21,330 |
| 2018 | $2,028 | $26,190 | $4,860 | $21,330 |
| 2017 | $1,995 | $25,450 | $4,720 | $20,730 |
| 2016 | $1,957 | $25,450 | $4,720 | $20,730 |
| 2015 | $1,888 | $0 | $0 | $0 |
| 2013 | $1,843 | $25,450 | $4,720 | $20,730 |
Map
- 143 Cherry Ln
- 106 Ruth Ct
- 102 Laurel Ln
- 230 Devron Cir
- 304 Dundee Rd
- 102 Ruth Ct
- 501 Whistling Strait
- 107 Florida Ave
- 103 Joseph Ct
- 107 Samuel Ct
- 111 Patriot Dr
- 215 Cypress Point
- 233 Briargate Rd
- 104 Independence Dr
- 252 Briargate Rd
- 801 Oakwood Rd
- 200 District Ct
- 2276 Robin Rd
- 508 Avondale Dr
- 618 Mickel Pkwy
Ask me questions while you tour the home.