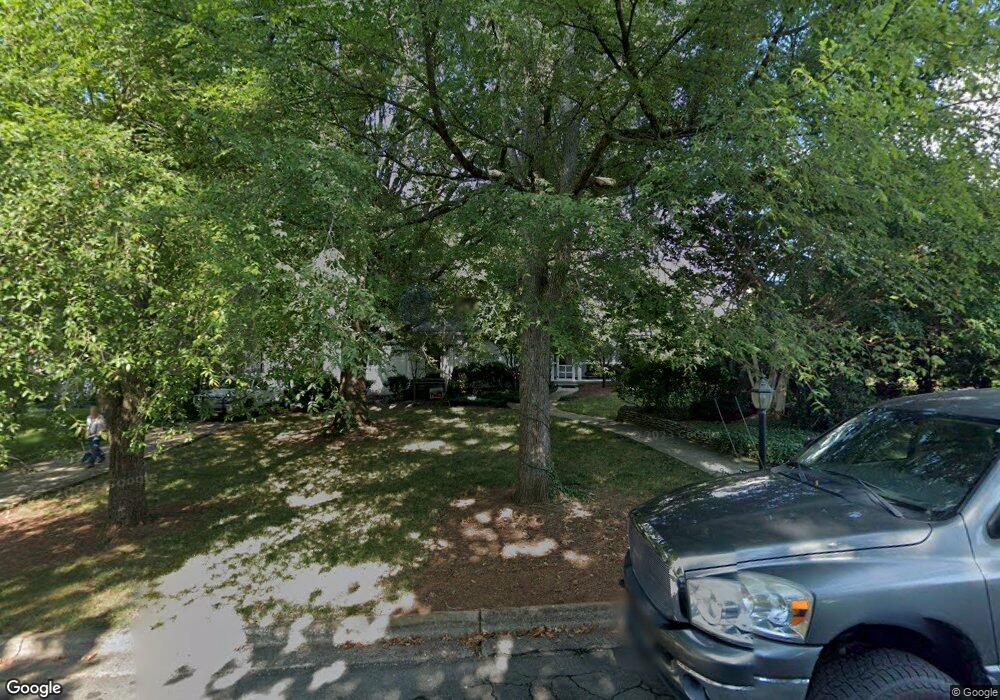
202 Chestnut St Lexington, NC 27292
Estimated Value: $415,622 - $517,000
4
Beds
3
Baths
4,433
Sq Ft
$105/Sq Ft
Est. Value
About This Home
This home is located at 202 Chestnut St, Lexington, NC 27292 and is currently estimated at $465,656, approximately $105 per square foot. 202 Chestnut St is a home located in Davidson County with nearby schools including South Lexington School, Lexington Middle School, and Lexington Senior High School.
Ownership History
Date
Name
Owned For
Owner Type
Purchase Details
Closed on
Nov 22, 2014
Sold by
Hayes John Jason and Hayes Anna Coleman
Bought by
Hayes John Jason and Hayes Anna Coleman
Current Estimated Value
Home Financials for this Owner
Home Financials are based on the most recent Mortgage that was taken out on this home.
Original Mortgage
$212,000
Interest Rate
3.95%
Mortgage Type
New Conventional
Purchase Details
Closed on
Jun 28, 2005
Sold by
Miller G Thompson G and Miller Kristie Dickinson
Bought by
Hayes John Jason and Hayes Anna Coleman
Home Financials for this Owner
Home Financials are based on the most recent Mortgage that was taken out on this home.
Original Mortgage
$208,000
Interest Rate
5.66%
Mortgage Type
Unknown
Purchase Details
Closed on
Oct 1, 1981
Create a Home Valuation Report for This Property
The Home Valuation Report is an in-depth analysis detailing your home's value as well as a comparison with similar homes in the area
Home Values in the Area
Average Home Value in this Area
Purchase History
| Date | Buyer | Sale Price | Title Company |
|---|---|---|---|
| Hayes John Jason | -- | None Available | |
| Hayes John Jason | $260,000 | None Available | |
| -- | $60,000 | -- |
Source: Public Records
Mortgage History
| Date | Status | Borrower | Loan Amount |
|---|---|---|---|
| Closed | Hayes John Jason | $212,000 | |
| Previous Owner | Hayes John Jason | $208,000 |
Source: Public Records
Tax History Compared to Growth
Tax History
| Year | Tax Paid | Tax Assessment Tax Assessment Total Assessment is a certain percentage of the fair market value that is determined by local assessors to be the total taxable value of land and additions on the property. | Land | Improvement |
|---|---|---|---|---|
| 2025 | $4,030 | $310,010 | $0 | $0 |
| 2024 | $4,030 | $310,010 | $0 | $0 |
| 2023 | $4,061 | $310,010 | $0 | $0 |
| 2022 | $4,030 | $310,010 | $0 | $0 |
| 2021 | $4,030 | $310,010 | $0 | $0 |
| 2020 | $3,416 | $264,760 | $0 | $0 |
| 2019 | $3,468 | $264,760 | $0 | $0 |
| 2018 | $3,468 | $264,760 | $0 | $0 |
| 2017 | $3,468 | $264,760 | $0 | $0 |
| 2016 | $3,468 | $264,770 | $0 | $0 |
| 2015 | $3,336 | $264,770 | $0 | $0 |
| 2014 | $3,601 | $285,800 | $0 | $0 |
Source: Public Records
Map
Nearby Homes
- 309 Hillcrest Dr
- 12 Vance Cir
- 510 W Center St
- 403 W Center St
- 22 Covey Ct
- 20 Martin Luther King jr Blvd
- 501 W 2nd Ave
- 214 W 5th St
- 433 N State St
- 120 W 1st Ave
- 411 Westside Dr
- 56 E 4th St
- 0 Swing Dairy Rd
- 415 S Ford St
- 816 Olympia St Unit 292
- 816 Olympia St
- 615 Westside Dr
- 610 Westside Dr
- Off Swing Dairg Rd
- 621 Park Cir