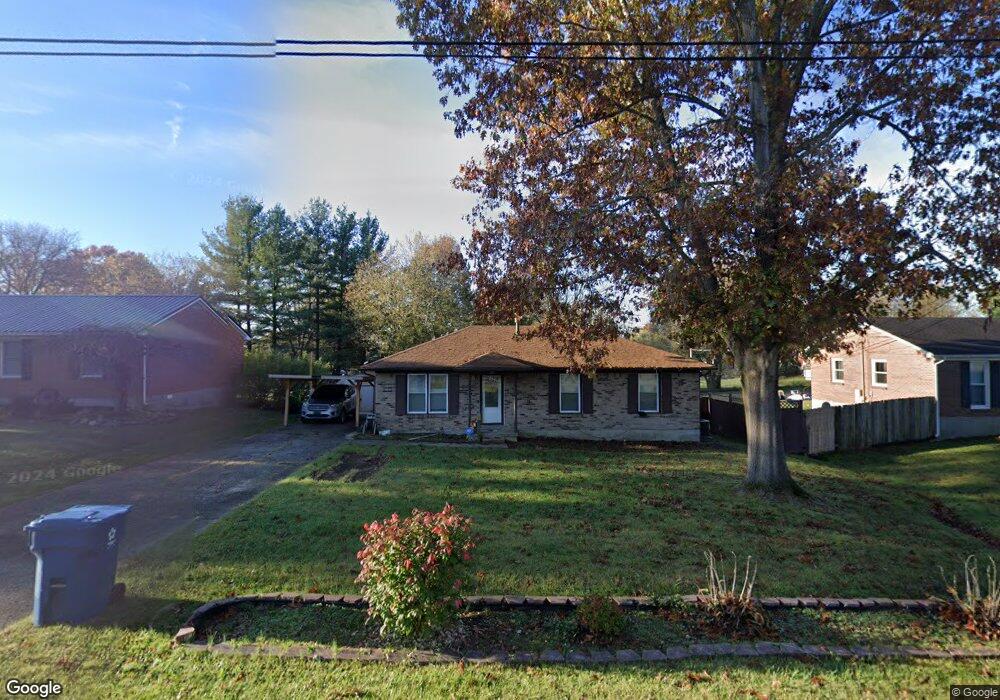
202 Clore Ave La Grange, KY 40031
Estimated Value: $205,954 - $227,000
3
Beds
1
Bath
1,032
Sq Ft
$207/Sq Ft
Est. Value
About This Home
This home is located at 202 Clore Ave, La Grange, KY 40031 and is currently estimated at $213,489, approximately $206 per square foot. 202 Clore Ave is a home located in Oldham County with nearby schools including Locust Grove Elementary School, Oldham County Middle School, and Oldham County High School.
Ownership History
Date
Name
Owned For
Owner Type
Purchase Details
Closed on
Sep 18, 2009
Sold by
Dawson Barry and Dawson Charlotte
Bought by
Foster Susan C
Current Estimated Value
Home Financials for this Owner
Home Financials are based on the most recent Mortgage that was taken out on this home.
Original Mortgage
$107,653
Outstanding Balance
$70,118
Interest Rate
5.11%
Mortgage Type
New Conventional
Estimated Equity
$143,371
Purchase Details
Closed on
Feb 25, 2009
Sold by
Hsbc Bank Usa Na
Bought by
Dawson Barry and Dawson Charlotte
Purchase Details
Closed on
Feb 8, 2005
Sold by
Davis Lois E and Davis Calvin R
Bought by
Brown Kelly and Brown Devera
Home Financials for this Owner
Home Financials are based on the most recent Mortgage that was taken out on this home.
Original Mortgage
$107,100
Interest Rate
8.5%
Mortgage Type
Assumption
Create a Home Valuation Report for This Property
The Home Valuation Report is an in-depth analysis detailing your home's value as well as a comparison with similar homes in the area
Home Values in the Area
Average Home Value in this Area
Purchase History
| Date | Buyer | Sale Price | Title Company |
|---|---|---|---|
| Foster Susan C | $105,500 | None Available | |
| Foster Susan C | $105,500 | None Available | |
| Dawson Barry | $60,000 | None Available | |
| Dawson Barry | $60,000 | None Available | |
| Brown Kelly | $100,500 | None Available |
Source: Public Records
Mortgage History
| Date | Status | Borrower | Loan Amount |
|---|---|---|---|
| Open | Foster Susan C | $107,653 | |
| Closed | Foster Susan C | $107,653 | |
| Previous Owner | Brown Kelly | $107,100 |
Source: Public Records
Tax History Compared to Growth
Tax History
| Year | Tax Paid | Tax Assessment Tax Assessment Total Assessment is a certain percentage of the fair market value that is determined by local assessors to be the total taxable value of land and additions on the property. | Land | Improvement |
|---|---|---|---|---|
| 2024 | $1,543 | $125,000 | $30,000 | $95,000 |
| 2023 | $1,601 | $125,000 | $30,000 | $95,000 |
| 2022 | $1,585 | $125,000 | $30,000 | $95,000 |
| 2021 | $1,575 | $125,000 | $30,000 | $95,000 |
| 2020 | $1,338 | $105,500 | $30,000 | $75,500 |
| 2019 | $1,326 | $105,500 | $30,000 | $75,500 |
| 2018 | $1,326 | $105,500 | $0 | $0 |
| 2017 | $1,317 | $105,500 | $0 | $0 |
| 2013 | $1,159 | $105,500 | $30,000 | $75,500 |
Source: Public Records
Map
Nearby Homes
- 708 Lakeview Ave
- 407 Maple Ct
- 311 Maple Ct
- 603 Powell St
- 303 E Jefferson St
- 210 S Cedar Ave
- 917 Woodland Ridge Cir
- 209 N Cedar St
- 206 E Madison St
- 904 Woodland Ridge Cir
- 1823 Bass Cir
- 1306 Heatherbourne Dr
- 1828 Bass Cir
- 1832 Bass Cir
- 1208 Keane Ave
- 1603 Pleasure Cove
- 1500 Walkerwood Ct
- 1625 Tina Ct
- 425 Mill Run Way
- 1202 Cedar Springs Pkwy