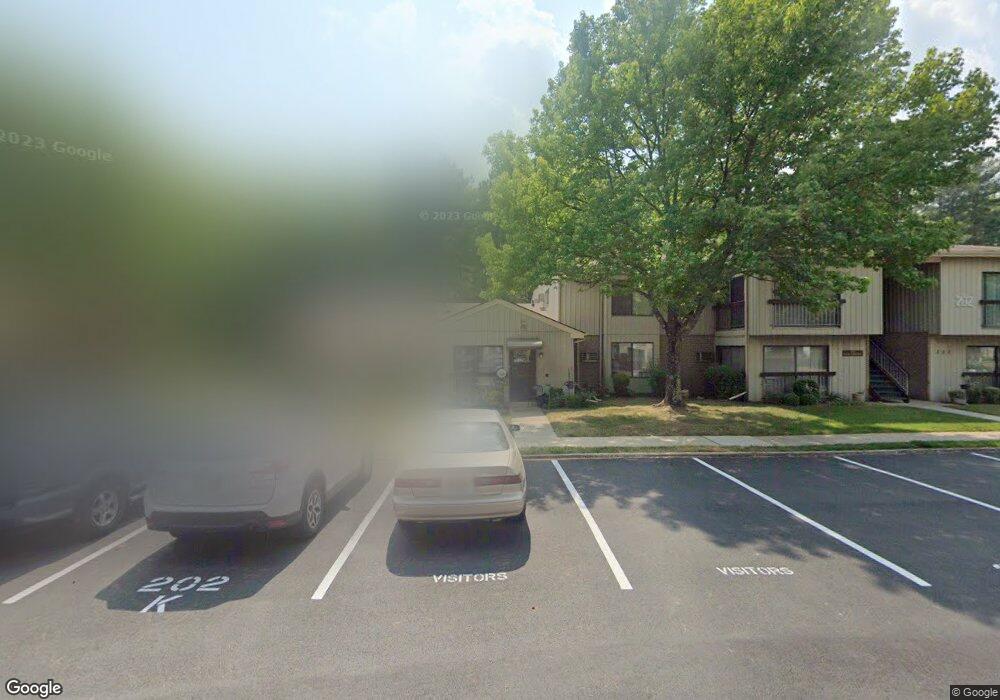
202 Covered Bridge Blvd Unit A Manalapan, NJ 07726
Estimated Value: $320,000 - $379,000
2
Beds
1
Bath
1,032
Sq Ft
$336/Sq Ft
Est. Value
About This Home
This home is located at 202 Covered Bridge Blvd Unit A, Manalapan, NJ 07726 and is currently estimated at $346,906, approximately $336 per square foot. 202 Covered Bridge Blvd Unit A is a home located in Monmouth County with nearby schools including Milford Brook Elementary School, Pine Brook Elementary School, and Manalapan-Englishtown Middle School.
Ownership History
Date
Name
Owned For
Owner Type
Purchase Details
Closed on
Aug 27, 2021
Sold by
Glow Properties Llc
Bought by
Mendoza Perez Mercedes
Current Estimated Value
Purchase Details
Closed on
Aug 21, 2021
Sold by
Glow Properties Llc
Bought by
Mendoza-Perez Mercedes
Purchase Details
Closed on
Mar 5, 2021
Sold by
Siminerio Laura J and Estate Of Florence Wilmot
Bought by
Glow Properties Llc
Purchase Details
Closed on
Jan 11, 2005
Sold by
Matias Raymond
Bought by
Florence Wilmot
Purchase Details
Closed on
Jul 9, 2003
Sold by
Lasser Stanford
Bought by
Matias Raymond
Purchase Details
Closed on
Nov 6, 2001
Sold by
Peckwasser Max
Bought by
Lesser Stanford and Lesser Sondra
Purchase Details
Closed on
Nov 3, 1995
Sold by
Stern Martha
Bought by
Peckwasser Max and Peckwasser Libby
Create a Home Valuation Report for This Property
The Home Valuation Report is an in-depth analysis detailing your home's value as well as a comparison with similar homes in the area
Home Values in the Area
Average Home Value in this Area
Purchase History
| Date | Buyer | Sale Price | Title Company |
|---|---|---|---|
| Mendoza Perez Mercedes | $290,000 | Legend Title Llc | |
| Mendoza-Perez Mercedes | $290,000 | Legend Title | |
| Glow Properties Llc | $200,000 | Investment Title Llc | |
| Glow Properties Llc | $200,000 | Investment Title | |
| Florence Wilmot | $175,000 | -- | |
| Matias Raymond | $149,900 | -- | |
| Lesser Stanford | $127,000 | -- | |
| Peckwasser Max | $90,000 | -- |
Source: Public Records
Tax History Compared to Growth
Tax History
| Year | Tax Paid | Tax Assessment Tax Assessment Total Assessment is a certain percentage of the fair market value that is determined by local assessors to be the total taxable value of land and additions on the property. | Land | Improvement |
|---|---|---|---|---|
| 2025 | $5,525 | $320,800 | $145,000 | $175,800 |
| 2024 | $5,378 | $327,300 | $153,000 | $174,300 |
| 2023 | $5,378 | $323,200 | $153,000 | $170,200 |
| 2022 | $3,656 | $277,100 | $115,000 | $162,100 |
| 2021 | $3,502 | $176,100 | $81,000 | $95,100 |
| 2020 | $3,502 | $170,600 | $76,000 | $94,600 |
| 2019 | $3,537 | $172,100 | $75,000 | $97,100 |
| 2018 | $3,258 | $157,600 | $65,000 | $92,600 |
| 2017 | $2,706 | $131,000 | $42,400 | $88,600 |
| 2016 | $2,659 | $130,200 | $34,900 | $95,300 |
| 2015 | $2,353 | $114,000 | $28,800 | $85,200 |
| 2014 | $2,603 | $122,800 | $30,000 | $92,800 |
Source: Public Records
Map
Nearby Homes
- 205 Covered Bridge Blvd Unit K
- 218 Medford Ct Unit A
- 141 Cross Slope Ct
- 141 Cross Slope Ct Unit A
- 154 Cross Slope Ct Unit G
- 236 Medford Ct Unit G
- 162 Cross Slope Ct Unit K
- 131 Amberly Dr Unit J
- 150 Amberly Dr Unit A
- 230 Medford Ct Unit C
- 167 Amberly Dr Unit H
- 93 Arrowood Rd Unit G
- 21 Wickatunk Rd
- 23 Eli Cir
- 86 Arrowood Rd Unit B
- 30 Meadow Green Cir Unit E
- 108 Amberly Dr Unit D
- 351 Sunshine Ct Unit 231
- 29 Meadow Green Cir Unit A
- 24 Meadow Green Cir Unit A
- 202 Covered Bridge Blvd Unit K
- 202 Covered Bridge Blvd Unit J
- 202 Covered Bridge Blvd Unit E
- 202 Covered Bridge Blvd Unit A
- 202 Covered Bridge Blvd Unit G
- 202 Covered Bridge Blvd Unit C
- 202 Covered Bridge Blvd Unit B
- 202 Covered Bridge Blvd Unit H
- 202 Covered Bridge Blvd Unit F
- 202 Covered Bridge Blvd Unit D
- 202 Covered Bridge Blvd
- 202 Covered Bridge Blvd Unit K
- 203 Covered Bridge Blvd Unit A
- 203 Covered Bridge Blvd Unit C
- 203 Covered Bridge Blvd Unit B
- 203 Covered Bridge Blvd Unit E
- 203 Covered Bridge Blvd Unit D
- 204 Covered Bridge Blvd Unit C
- 204 Covered Bridge Blvd Unit H
- 204 Covered Bridge Blvd Unit D