Estimated Value: $298,000 - $323,000
3
Beds
2
Baths
1,565
Sq Ft
$200/Sq Ft
Est. Value
About This Home
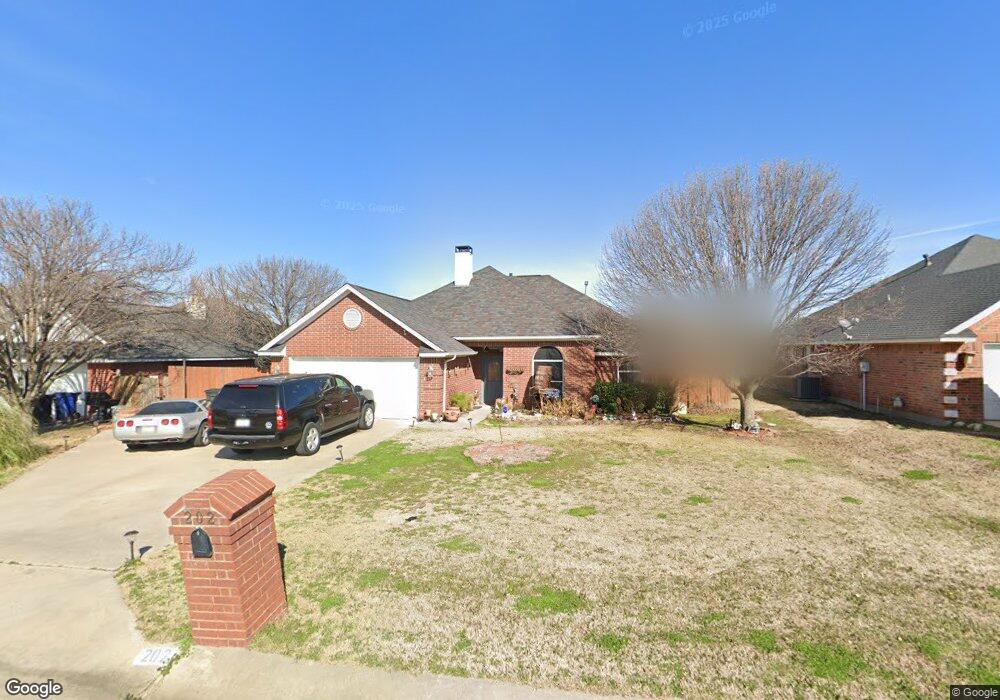
This home is located at 202 Dove Meadows, Krum, TX 76249 and is currently estimated at $313,448, approximately $200 per square foot. 202 Dove Meadows is a home located in Denton County with nearby schools including Krum Early Education Center, Blanche Dodd Intermediate School, and Krum Middle School.
Ownership History
Date
Name
Owned For
Owner Type
Purchase Details
Closed on
Aug 31, 2005
Sold by
Crenshaw James David and Crenshaw Donna Jean
Bought by
Lovell Justin S
Current Estimated Value
Home Financials for this Owner
Home Financials are based on the most recent Mortgage that was taken out on this home.
Original Mortgage
$121,043
Outstanding Balance
$64,595
Interest Rate
5.81%
Mortgage Type
FHA
Estimated Equity
$248,853
Purchase Details
Closed on
May 19, 1999
Sold by
Jhr Construction Inc
Bought by
Crenshaw James David and Birkhimer Donna Jean
Home Financials for this Owner
Home Financials are based on the most recent Mortgage that was taken out on this home.
Original Mortgage
$95,950
Interest Rate
6.94%
Purchase Details
Closed on
Feb 17, 1999
Sold by
Dove Meadows Estates Joint Venture
Bought by
Jhr Construction Co Inc
Home Financials for this Owner
Home Financials are based on the most recent Mortgage that was taken out on this home.
Original Mortgage
$80,784
Interest Rate
6.83%
Mortgage Type
Purchase Money Mortgage
Create a Home Valuation Report for This Property
The Home Valuation Report is an in-depth analysis detailing your home's value as well as a comparison with similar homes in the area
Home Values in the Area
Average Home Value in this Area
Purchase History
| Date | Buyer | Sale Price | Title Company |
|---|---|---|---|
| Lovell Justin S | -- | Sierra Title | |
| Crenshaw James David | -- | -- | |
| Jhr Construction Co Inc | -- | -- |
Source: Public Records
Mortgage History
| Date | Status | Borrower | Loan Amount |
|---|---|---|---|
| Open | Lovell Justin S | $121,043 | |
| Previous Owner | Crenshaw James David | $95,950 | |
| Previous Owner | Jhr Construction Co Inc | $80,784 |
Source: Public Records
Tax History Compared to Growth
Tax History
| Year | Tax Paid | Tax Assessment Tax Assessment Total Assessment is a certain percentage of the fair market value that is determined by local assessors to be the total taxable value of land and additions on the property. | Land | Improvement |
|---|---|---|---|---|
| 2025 | $1,911 | $317,222 | $59,820 | $257,402 |
| 2024 | $5,888 | $292,193 | $0 | $0 |
| 2023 | $1,753 | $265,630 | $59,820 | $251,158 |
| 2022 | $5,539 | $241,482 | $59,820 | $221,476 |
| 2021 | $4,868 | $231,740 | $35,892 | $195,848 |
| 2020 | $4,519 | $199,571 | $35,892 | $184,120 |
| 2019 | $4,378 | $181,429 | $35,892 | $182,630 |
| 2018 | $4,000 | $164,935 | $25,922 | $139,013 |
| 2017 | $3,961 | $162,612 | $25,922 | $136,690 |
| 2016 | $2,702 | $149,290 | $25,922 | $128,996 |
| 2015 | $3,190 | $135,718 | $25,922 | $109,796 |
| 2014 | $3,190 | $129,691 | $25,922 | $103,769 |
| 2013 | -- | $129,532 | $25,922 | $103,610 |
Source: Public Records
Map
Nearby Homes
- 204 Dove Meadows
- 200 Dove Meadows
- 203 Mourning Dove Ln
- 206 Dove Meadows
- 201 Mourning Dove Ln
- 203 Dove Meadows
- 205 Mourning Dove Ln
- 205 Dove Meadows
- 201 Dove Meadows
- 208 Dove Meadows
- 207 Dove Meadows
- 207 Mourning Dove Ln
- 209 Dove Meadows
- 210 Dove Meadows
- 202 Brook Cir
- 209 Mourning Dove Ln
- 204 Brook Cir
- 200 Brook Cir
- 202 Mourning Dove Ln
- 200 Mourning Dove Ln