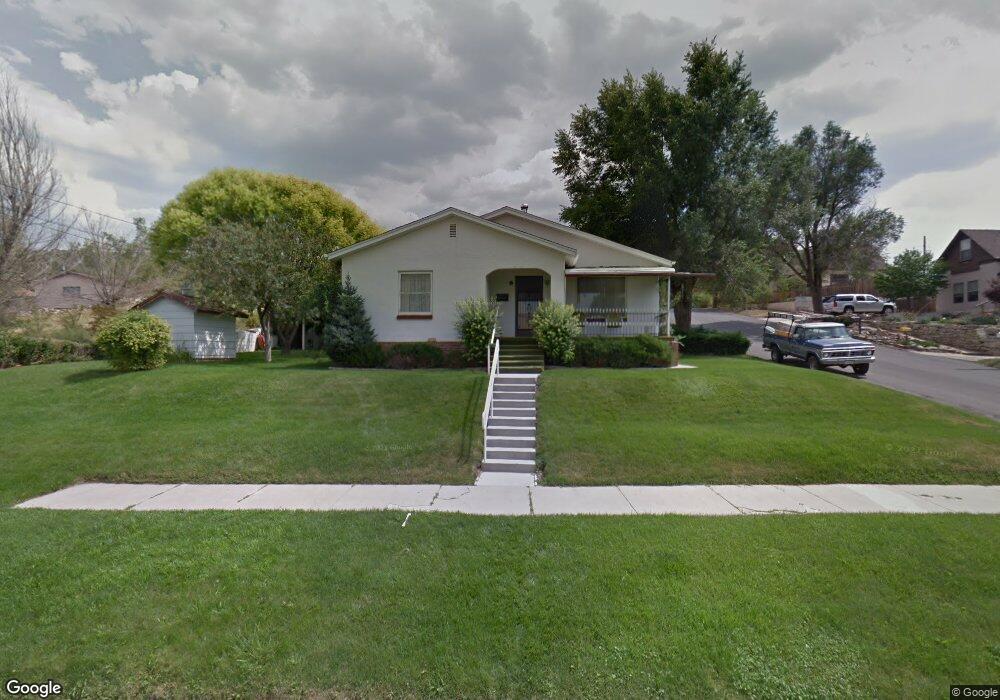
202 E 7th St Trinidad, CO 81082
Estimated Value: $241,000 - $516,000
3
Beds
2
Baths
2,546
Sq Ft
$132/Sq Ft
Est. Value
About This Home
This home is located at 202 E 7th St, Trinidad, CO 81082 and is currently estimated at $336,884, approximately $132 per square foot. 202 E 7th St is a home with nearby schools including Fisher's Peak Elementary School, Trinidad Middle School, and Trinidad High School.
Ownership History
Date
Name
Owned For
Owner Type
Purchase Details
Closed on
Jul 21, 2025
Sold by
Antista Jessica M
Bought by
Antista Joseph J
Current Estimated Value
Purchase Details
Closed on
May 15, 2015
Sold by
Antista Joseph J
Bought by
Antista Jessica Marguerite
Home Financials for this Owner
Home Financials are based on the most recent Mortgage that was taken out on this home.
Original Mortgage
$133,450
Interest Rate
2.97%
Mortgage Type
New Conventional
Create a Home Valuation Report for This Property
The Home Valuation Report is an in-depth analysis detailing your home's value as well as a comparison with similar homes in the area
Purchase History
| Date | Buyer | Sale Price | Title Company |
|---|---|---|---|
| Antista Joseph J | -- | None Listed On Document | |
| Antista Joseph J | -- | None Listed On Document | |
| Antista Jessica Marguerite | $168,000 | None Available |
Source: Public Records
Mortgage History
| Date | Status | Borrower | Loan Amount |
|---|---|---|---|
| Previous Owner | Antista Jessica Marguerite | $133,450 |
Source: Public Records
Tax History
| Year | Tax Paid | Tax Assessment Tax Assessment Total Assessment is a certain percentage of the fair market value that is determined by local assessors to be the total taxable value of land and additions on the property. | Land | Improvement |
|---|---|---|---|---|
| 2025 | $921 | $22,620 | $2,930 | $19,690 |
| 2024 | $921 | $20,860 | $2,930 | $17,930 |
| 2023 | $921 | $17,190 | $2,420 | $14,770 |
| 2022 | $710 | $13,760 | $3,040 | $10,720 |
| 2021 | $723 | $14,160 | $3,130 | $11,030 |
| 2020 | $585 | $11,630 | $3,130 | $8,500 |
| 2019 | $6 | $11,630 | $3,130 | $8,500 |
| 2018 | $600 | $11,710 | $3,150 | $8,560 |
| 2017 | $582 | $11,710 | $0 | $0 |
| 2015 | $629 | $12,943 | $0 | $0 |
| 2013 | $325 | $12,943 | $3,485 | $9,458 |
Source: Public Records
Map
Nearby Homes
Your Personal Tour Guide
Ask me questions while you tour the home.