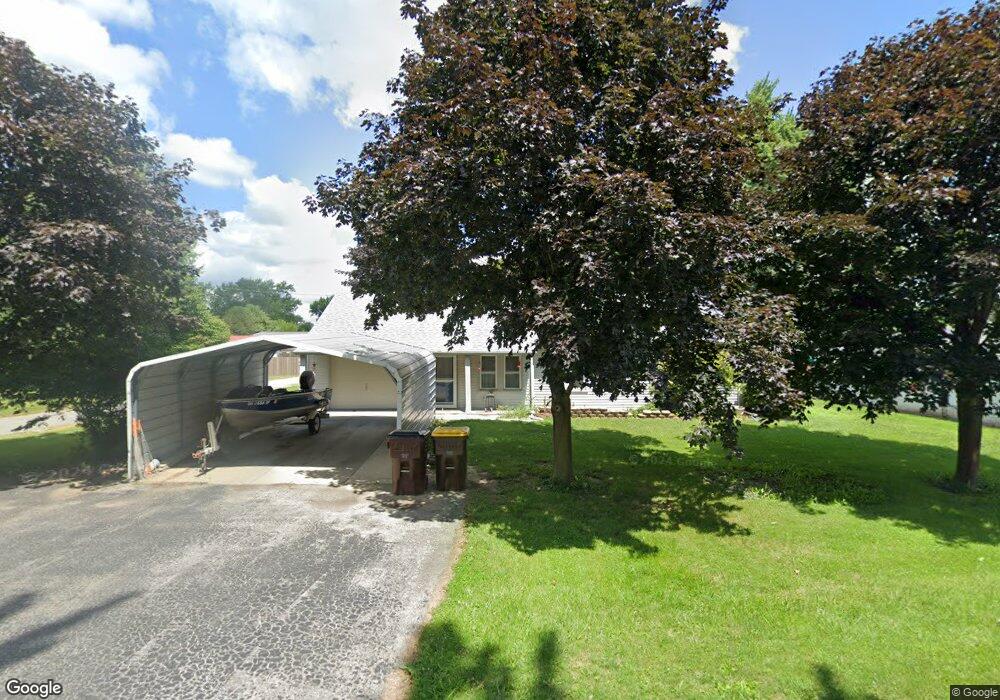
202 E Allison St Stryker, OH 43557
Estimated Value: $143,000 - $154,000
2
Beds
1
Bath
1,344
Sq Ft
$111/Sq Ft
Est. Value
About This Home
This home is located at 202 E Allison St, Stryker, OH 43557 and is currently estimated at $149,482, approximately $111 per square foot. 202 E Allison St is a home located in Williams County with nearby schools including Stryker Elementary School and Stryker High School.
Ownership History
Date
Name
Owned For
Owner Type
Purchase Details
Closed on
Aug 26, 2021
Sold by
Vogel Kennedy P and Vogel Jacob
Bought by
Martinez Adrianna
Current Estimated Value
Home Financials for this Owner
Home Financials are based on the most recent Mortgage that was taken out on this home.
Original Mortgage
$111,111
Outstanding Balance
$99,994
Interest Rate
2.8%
Mortgage Type
New Conventional
Estimated Equity
$49,488
Purchase Details
Closed on
Jun 22, 2018
Sold by
Stubblefield Jason W and Stubblefield Sarah E
Bought by
Replogle Kennedy P
Home Financials for this Owner
Home Financials are based on the most recent Mortgage that was taken out on this home.
Original Mortgage
$66,500
Interest Rate
4.6%
Mortgage Type
New Conventional
Purchase Details
Closed on
Mar 13, 2003
Sold by
Headley Harley C And
Bought by
Stubblefield Jason W and Stubblefield Sarah H
Purchase Details
Closed on
Jan 1, 1990
Bought by
Headley Harley C And
Create a Home Valuation Report for This Property
The Home Valuation Report is an in-depth analysis detailing your home's value as well as a comparison with similar homes in the area
Purchase History
| Date | Buyer | Sale Price | Title Company |
|---|---|---|---|
| Martinez Adrianna | $110,000 | Title Assurance Group Ltd | |
| Replogle Kennedy P | $70,000 | Merestone Title Agency | |
| Stubblefield Jason W | $68,900 | -- | |
| Headley Harley C And | -- | -- |
Source: Public Records
Mortgage History
| Date | Status | Borrower | Loan Amount |
|---|---|---|---|
| Open | Martinez Adrianna | $111,111 | |
| Previous Owner | Replogle Kennedy P | $66,500 |
Source: Public Records
Tax History
| Year | Tax Paid | Tax Assessment Tax Assessment Total Assessment is a certain percentage of the fair market value that is determined by local assessors to be the total taxable value of land and additions on the property. | Land | Improvement |
|---|---|---|---|---|
| 2025 | $1,598 | $37,910 | $4,730 | $33,180 |
| 2024 | $1,598 | $37,910 | $4,730 | $33,180 |
| 2023 | $1,583 | $24,570 | $4,760 | $19,810 |
| 2022 | $1,156 | $24,570 | $4,760 | $19,810 |
| 2021 | $1,155 | $24,570 | $4,760 | $19,810 |
| 2020 | $1,025 | $20,650 | $3,990 | $16,660 |
| 2019 | $1,029 | $20,650 | $3,990 | $16,660 |
| 2018 | $960 | $20,650 | $3,990 | $16,660 |
| 2017 | $963 | $19,430 | $4,200 | $15,230 |
| 2016 | $892 | $19,430 | $4,200 | $15,230 |
| 2015 | $900 | $19,430 | $4,200 | $15,230 |
| 2014 | $900 | $18,480 | $3,990 | $14,490 |
| 2013 | $912 | $18,480 | $3,990 | $14,490 |
Source: Public Records
Map
Nearby Homes
- 200 Tyler Ln
- 302 Tyler Ln
- 301 Horton St
- 20095 County Road H50
- 17738 County Rd E
- V-526 Co Rd 25
- 210 Lakeview Dr
- 110 Shaffer Blvd
- 107 Shaffer Blvd
- 0 Lafayette St
- 800 Walnut St
- 16299 County Road F75
- 202 Short-Buehrer Rd
- 226 Burke St
- 224 Hawthorn Dr
- 301 N Pointe Dr
- 808 West St
- 408 Ditto St
- 433 Primrose Ln
- 18390 Williams Defiance County Line Rd
Your Personal Tour Guide
Ask me questions while you tour the home.