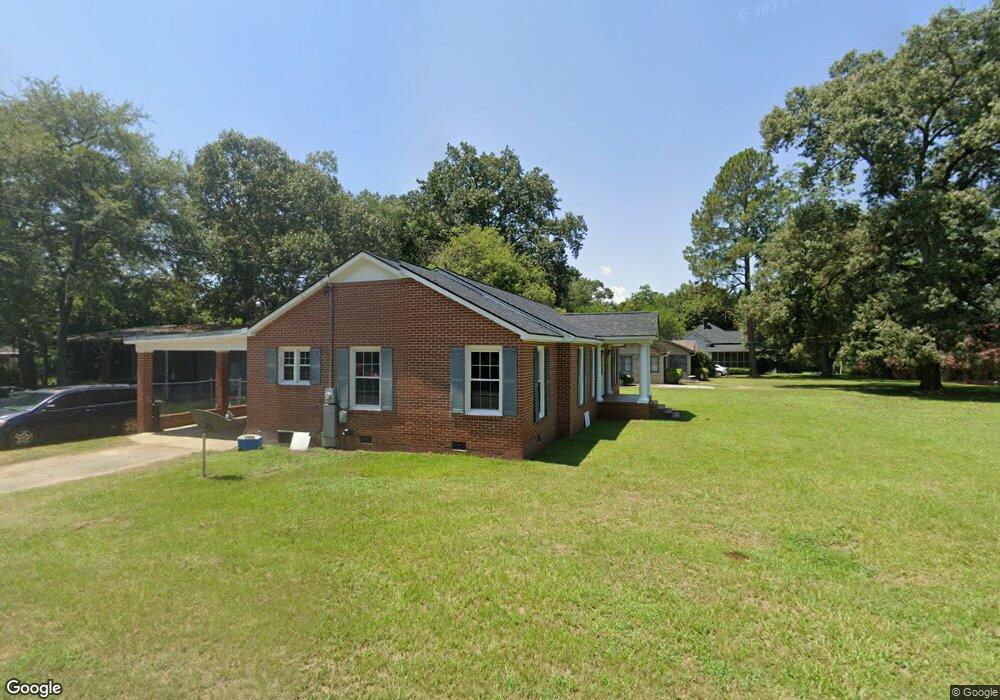
202 E Beech St Cochran, GA 31014
Estimated Value: $172,000 - $219,980
4
Beds
2
Baths
2,784
Sq Ft
$72/Sq Ft
Est. Value
About This Home
This home is located at 202 E Beech St, Cochran, GA 31014 and is currently estimated at $200,995, approximately $72 per square foot. 202 E Beech St is a home located in Bleckley County with nearby schools including Bleckley County Primary School, Bleckley County Elementary School, and Bleckley Middle School.
Ownership History
Date
Name
Owned For
Owner Type
Purchase Details
Closed on
Oct 7, 2022
Sold by
Mullis Amanda R
Bought by
Watson Linda
Current Estimated Value
Purchase Details
Closed on
Jun 5, 2013
Sold by
Watson Linda
Bought by
Watson Linda and Mullis Amanda R
Purchase Details
Closed on
Jan 27, 2005
Sold by
Watson Linda
Bought by
Manning Linda
Home Financials for this Owner
Home Financials are based on the most recent Mortgage that was taken out on this home.
Original Mortgage
$80,790
Interest Rate
5.72%
Mortgage Type
New Conventional
Purchase Details
Closed on
May 22, 2002
Sold by
Tillyer Michael E
Bought by
Watson Linda
Purchase Details
Closed on
Feb 29, 2000
Sold by
Adams John C
Bought by
Tillyer Michael E
Purchase Details
Closed on
Jul 10, 1998
Sold by
King Irene Abney
Bought by
Adams John C
Purchase Details
Closed on
Jun 2, 1976
Bought by
King Irene A
Create a Home Valuation Report for This Property
The Home Valuation Report is an in-depth analysis detailing your home's value as well as a comparison with similar homes in the area
Home Values in the Area
Average Home Value in this Area
Purchase History
| Date | Buyer | Sale Price | Title Company |
|---|---|---|---|
| Watson Linda | -- | -- | |
| Watson Linda | -- | -- | |
| Manning Linda | -- | -- | |
| Watson Linda | $112,500 | -- | |
| Tillyer Michael E | $78,000 | -- | |
| Adams John C | $67,500 | -- | |
| King Irene Abney | -- | -- | |
| King Irene A | -- | -- |
Source: Public Records
Mortgage History
| Date | Status | Borrower | Loan Amount |
|---|---|---|---|
| Previous Owner | Manning Linda | $80,790 |
Source: Public Records
Tax History
| Year | Tax Paid | Tax Assessment Tax Assessment Total Assessment is a certain percentage of the fair market value that is determined by local assessors to be the total taxable value of land and additions on the property. | Land | Improvement |
|---|---|---|---|---|
| 2025 | $3,275 | $87,640 | $1,480 | $86,160 |
| 2024 | $3,302 | $87,640 | $1,480 | $86,160 |
| 2023 | $3,581 | $87,640 | $1,480 | $86,160 |
| 2022 | $2,110 | $77,560 | $1,480 | $76,080 |
| 2021 | $1,678 | $59,080 | $1,480 | $57,600 |
| 2020 | $1,685 | $59,080 | $1,480 | $57,600 |
| 2019 | $1,481 | $51,949 | $4,000 | $47,949 |
| 2018 | $2,100 | $51,949 | $4,000 | $47,949 |
| 2017 | $1,509 | $51,949 | $4,000 | $47,949 |
| 2016 | $1,524 | $52,269 | $4,000 | $48,269 |
| 2015 | -- | $52,269 | $4,000 | $48,269 |
| 2014 | -- | $52,269 | $4,000 | $48,269 |
| 2013 | -- | $52,269 | $4,000 | $48,269 |
Source: Public Records
Map
Nearby Homes
Your Personal Tour Guide
Ask me questions while you tour the home.