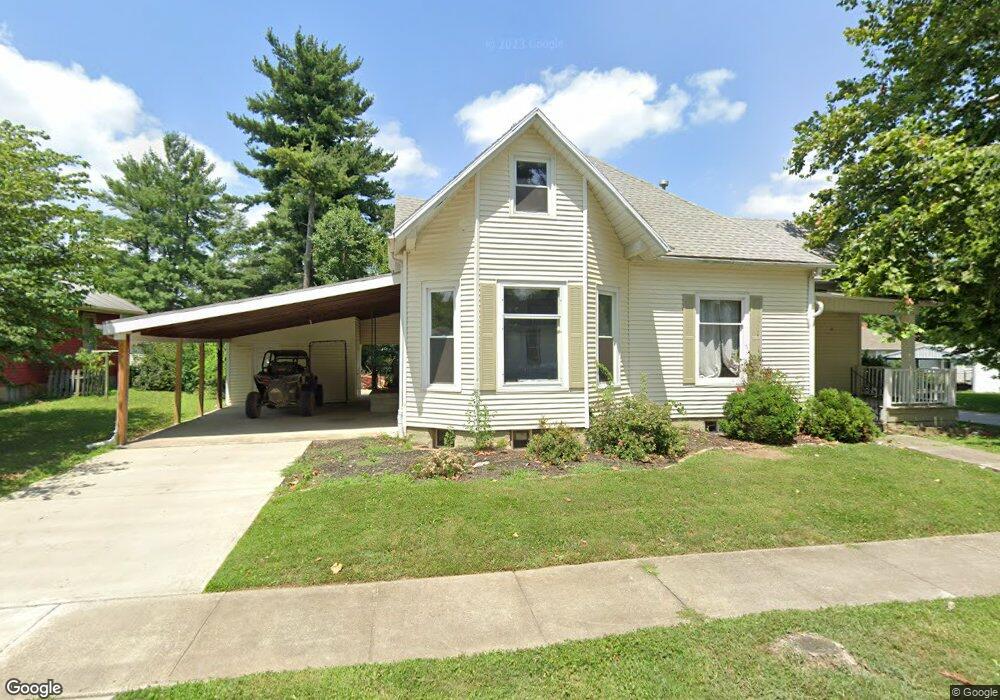
202 E John St Fort Branch, IN 47648
Estimated Value: $197,000 - $241,000
3
Beds
2
Baths
2,295
Sq Ft
$95/Sq Ft
Est. Value
About This Home
This home is located at 202 E John St, Fort Branch, IN 47648 and is currently estimated at $218,702, approximately $95 per square foot. 202 E John St is a home located in Gibson County with nearby schools including Gibson Southern High School and Holy Cross School.
Ownership History
Date
Name
Owned For
Owner Type
Purchase Details
Closed on
Dec 12, 2022
Sold by
Ipb Llc
Bought by
Lantero Brittnie
Current Estimated Value
Home Financials for this Owner
Home Financials are based on the most recent Mortgage that was taken out on this home.
Original Mortgage
$145,500
Outstanding Balance
$140,614
Interest Rate
6.33%
Estimated Equity
$78,088
Purchase Details
Closed on
Jul 5, 2019
Sold by
Wells Fargo Bank Na
Bought by
Ipb Llc
Purchase Details
Closed on
Aug 16, 2018
Sold by
Not Provided
Bought by
Wells Fargo Bank Na
Purchase Details
Closed on
Oct 14, 2011
Sold by
Wilson Diane L
Bought by
Rivera Giovanni R and Rodriguez Lydia M
Purchase Details
Closed on
Jul 15, 2010
Sold by
Diane L Wilson
Bought by
Giovanni Rodriguez Rivera and Rodriguez Lydia M
Create a Home Valuation Report for This Property
The Home Valuation Report is an in-depth analysis detailing your home's value as well as a comparison with similar homes in the area
Home Values in the Area
Average Home Value in this Area
Purchase History
| Date | Buyer | Sale Price | Title Company |
|---|---|---|---|
| Lantero Brittnie | -- | -- | |
| Ipb Llc | -- | -- | |
| Wells Fargo Bank Na | $48,750 | -- | |
| Rivera Giovanni R | $82,000 | Foreman Watson Land Title Ll | |
| Giovanni Rodriguez Rivera | $76,000 | Law Office Of Ray Druley | |
| Giovanni Lydia M | $76,000 | Law Office Of Ray Druley |
Source: Public Records
Mortgage History
| Date | Status | Borrower | Loan Amount |
|---|---|---|---|
| Open | Lantero Brittnie | $145,500 |
Source: Public Records
Tax History
| Year | Tax Paid | Tax Assessment Tax Assessment Total Assessment is a certain percentage of the fair market value that is determined by local assessors to be the total taxable value of land and additions on the property. | Land | Improvement |
|---|---|---|---|---|
| 2024 | $1,767 | $191,700 | $13,900 | $177,800 |
| 2023 | $1,681 | $177,300 | $13,900 | $163,400 |
| 2022 | $1,191 | $134,700 | $13,900 | $120,800 |
| 2021 | $2,429 | $121,200 | $13,900 | $107,300 |
| 2020 | $2,268 | $113,200 | $13,900 | $99,300 |
| 2019 | $2,124 | $106,000 | $13,900 | $92,100 |
| 2018 | $816 | $104,800 | $13,900 | $90,900 |
| 2017 | $1,129 | $102,100 | $13,900 | $88,200 |
| 2016 | $658 | $98,200 | $13,900 | $84,300 |
| 2014 | $617 | $98,500 | $13,900 | $84,600 |
| 2013 | -- | $99,300 | $13,900 | $85,400 |
Source: Public Records
Map
Nearby Homes
- 500 N Church St
- 206 N Church St
- 104 N Walters St
- 806 E Park St
- 209 S Main St
- 986 Indiana 168
- 205 S Us Highway 41
- 6000 S Us Hwy 41 N
- 0 S 325 W
- 206 W Gibson St
- 10160 S Quail Crossing
- 301 S 4th Ave
- 525 S 8th Ave
- 000 S 200 E
- 11088 S Owensville Rd
- 81 E 200 S
- 12444 Brook Dr
- 416 E Walnut St
- 2352 E Warrenton Rd
- 12646 S 200 E