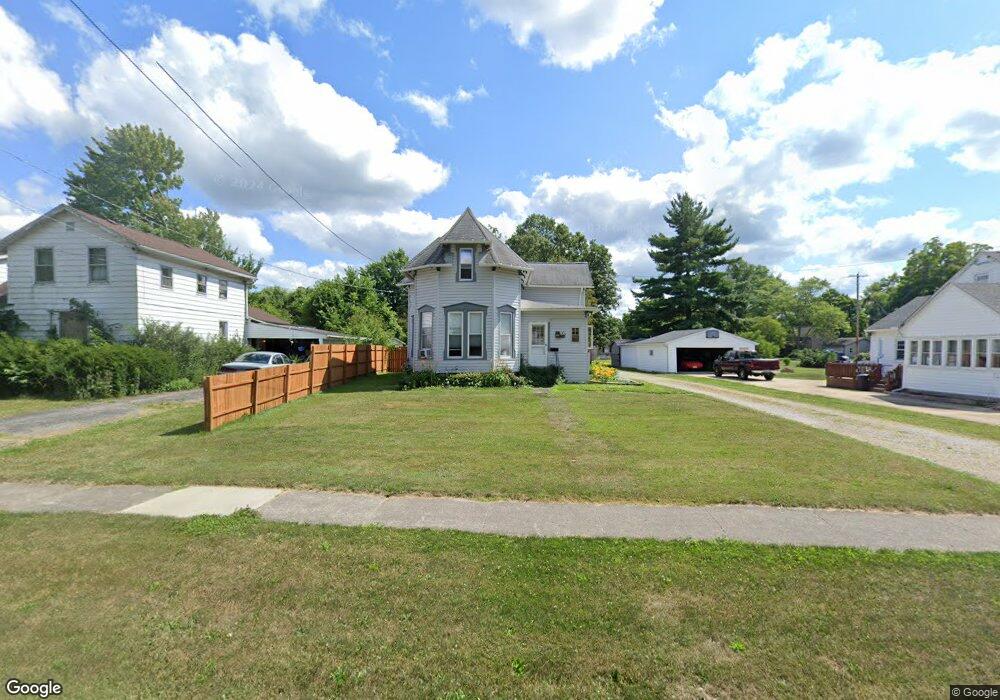
202 E Main St New London, OH 44851
Estimated Value: $121,000 - $182,000
4
Beds
2
Baths
1,886
Sq Ft
$83/Sq Ft
Est. Value
About This Home
This home is located at 202 E Main St, New London, OH 44851 and is currently estimated at $155,891, approximately $82 per square foot. 202 E Main St is a home located in Huron County with nearby schools including New London Elementary School, New London Middle School, and New London High School.
Ownership History
Date
Name
Owned For
Owner Type
Purchase Details
Closed on
Mar 27, 2020
Sold by
Mccracken Preston
Bought by
Coya Nina M
Current Estimated Value
Home Financials for this Owner
Home Financials are based on the most recent Mortgage that was taken out on this home.
Original Mortgage
$55,000
Outstanding Balance
$43,689
Interest Rate
3.4%
Mortgage Type
Future Advance Clause Open End Mortgage
Estimated Equity
$112,202
Purchase Details
Closed on
Aug 23, 2017
Sold by
U S Bank National Association
Bought by
Mccracken Preston
Purchase Details
Closed on
Jun 28, 2017
Sold by
Pleska Lisa J and Pleska Brian K
Bought by
U S Bank National Association
Purchase Details
Closed on
May 16, 2005
Bought by
Pleska Brian K and Pleska Lisa J
Purchase Details
Closed on
Jun 10, 2003
Bought by
Pleska Royle G
Purchase Details
Closed on
Nov 12, 2002
Sold by
Whitmer Eugene M
Bought by
Companion Mortgage Corp
Purchase Details
Closed on
Nov 15, 1991
Bought by
Whitmer Eugene M
Create a Home Valuation Report for This Property
The Home Valuation Report is an in-depth analysis detailing your home's value as well as a comparison with similar homes in the area
Home Values in the Area
Average Home Value in this Area
Purchase History
| Date | Buyer | Sale Price | Title Company |
|---|---|---|---|
| Coya Nina M | $65,000 | Chicago Title Agency | |
| Mccracken Preston | $35,500 | Attorney | |
| U S Bank National Association | $50,000 | None Available | |
| Pleska Brian K | -- | -- | |
| Pleska Royle G | $43,200 | -- | |
| Companion Mortgage Corp | $36,000 | -- | |
| Whitmer Eugene M | $40,500 | -- |
Source: Public Records
Mortgage History
| Date | Status | Borrower | Loan Amount |
|---|---|---|---|
| Open | Coya Nina M | $55,000 |
Source: Public Records
Tax History
| Year | Tax Paid | Tax Assessment Tax Assessment Total Assessment is a certain percentage of the fair market value that is determined by local assessors to be the total taxable value of land and additions on the property. | Land | Improvement |
|---|---|---|---|---|
| 2025 | $1,506 | $41,260 | $6,050 | $35,210 |
| 2024 | $1,506 | $41,260 | $6,050 | $35,210 |
| 2023 | $1,500 | $31,770 | $5,010 | $26,760 |
| 2022 | $1,115 | $31,770 | $5,010 | $26,760 |
| 2021 | $1,116 | $31,770 | $5,010 | $26,760 |
| 2020 | $1,069 | $27,800 | $5,010 | $22,790 |
| 2019 | $1,064 | $27,800 | $5,010 | $22,790 |
| 2018 | $1,040 | $27,800 | $5,010 | $22,790 |
| 2017 | $922 | $26,530 | $5,010 | $21,520 |
| 2016 | $885 | $26,530 | $5,010 | $21,520 |
| 2015 | $884 | $26,550 | $5,020 | $21,530 |
| 2014 | $793 | $23,350 | $5,010 | $18,340 |
| 2013 | $787 | $23,350 | $5,010 | $18,340 |
Source: Public Records
Map
Nearby Homes
- 152 E Main St
- 113 3rd St
- 63 N Maple St
- 159 New London Ave
- 3 Buckeye St
- 92 S Main St
- 0 Section Line Rd Unit 20253852
- 49 Cedar St
- 21 Cedar St
- 115 W Main St
- 22 E Fir St
- 243 Park Ave
- 34 Daisy Dr
- 5854 Ohio 162
- 5854 State Route 162 E
- 141 State Route 60
- 52814 New London Eastern Rd
- 3245 US Highway 250
- 2441 U S 250
- 52819 Bursley Rd
Your Personal Tour Guide
Ask me questions while you tour the home.