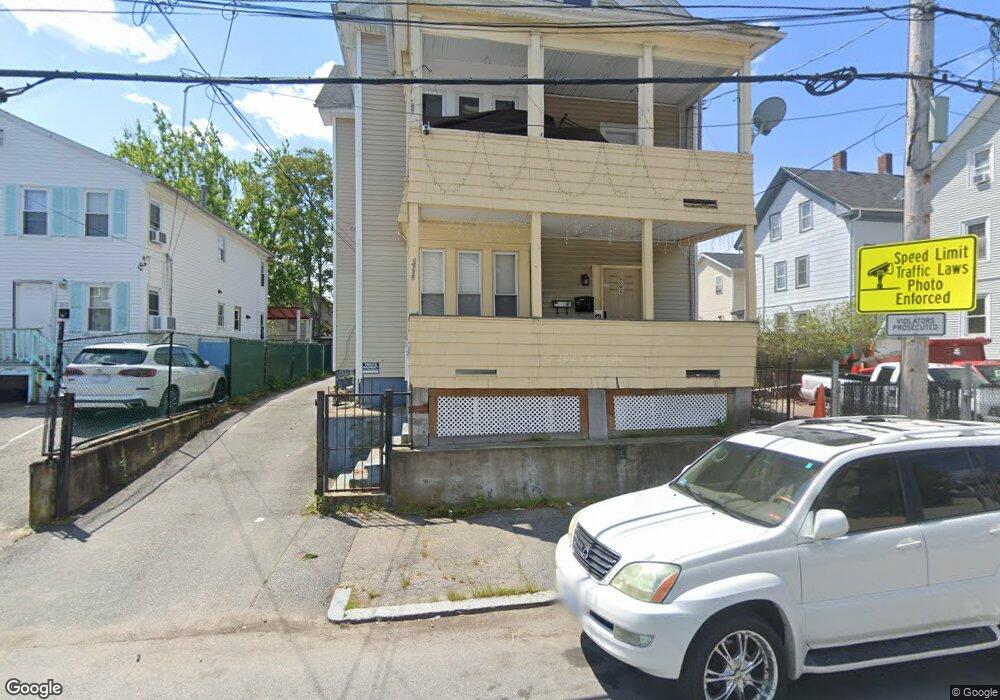
202 Eastwood Ave Providence, RI 02909
Silver Lake NeighborhoodEstimated Value: $435,000 - $566,000
6
Beds
3
Baths
2,600
Sq Ft
$192/Sq Ft
Est. Value
About This Home
This home is located at 202 Eastwood Ave, Providence, RI 02909 and is currently estimated at $500,333, approximately $192 per square foot. 202 Eastwood Ave is a home located in Providence County with nearby schools including Charles N. Fortes Elementary School, Asa Messer Elementary School, and Laurel Hill Annex School.
Ownership History
Date
Name
Owned For
Owner Type
Purchase Details
Closed on
Jun 25, 2010
Sold by
Bank Of New York
Bought by
Calderon Juan
Current Estimated Value
Home Financials for this Owner
Home Financials are based on the most recent Mortgage that was taken out on this home.
Original Mortgage
$132,554
Interest Rate
4.98%
Mortgage Type
Purchase Money Mortgage
Purchase Details
Closed on
Jan 14, 2010
Sold by
Mers
Bought by
Bank Of New York
Purchase Details
Closed on
Jun 17, 2009
Sold by
Torres Pastora and Taylor Bean
Bought by
Taylor Bean and Taylor Whitaker M
Purchase Details
Closed on
Sep 27, 2005
Sold by
Perez Juan V
Bought by
Torres Jose and Perez-Torres Pastora
Purchase Details
Closed on
Jan 30, 2002
Sold by
Rosa Jose R
Bought by
Perez Juan V
Purchase Details
Closed on
Feb 24, 1997
Sold by
Guindon Karen L
Bought by
Guindon Wayne B
Purchase Details
Closed on
Dec 23, 1996
Sold by
Pnc Mortgage Corp Amer
Bought by
Slater Investments Llc
Create a Home Valuation Report for This Property
The Home Valuation Report is an in-depth analysis detailing your home's value as well as a comparison with similar homes in the area
Home Values in the Area
Average Home Value in this Area
Purchase History
| Date | Buyer | Sale Price | Title Company |
|---|---|---|---|
| Calderon Juan | $135,000 | -- | |
| Bank Of New York | -- | -- | |
| Bank Of New York | -- | -- | |
| Taylor Bean | $289,634 | -- | |
| Torres Jose | $310,000 | -- | |
| Perez Juan V | $100,000 | -- | |
| Guindon Wayne B | $98,000 | -- | |
| Slater Investments Llc | $36,000 | -- |
Source: Public Records
Mortgage History
| Date | Status | Borrower | Loan Amount |
|---|---|---|---|
| Open | Slater Investments Llc | $143,569 | |
| Closed | Slater Investments Llc | $132,554 |
Source: Public Records
Tax History Compared to Growth
Tax History
| Year | Tax Paid | Tax Assessment Tax Assessment Total Assessment is a certain percentage of the fair market value that is determined by local assessors to be the total taxable value of land and additions on the property. | Land | Improvement |
|---|---|---|---|---|
| 2025 | $3,498 | $463,300 | $128,000 | $335,300 |
| 2024 | $5,588 | $304,500 | $72,000 | $232,500 |
| 2023 | $5,588 | $304,500 | $72,000 | $232,500 |
| 2022 | $5,420 | $304,500 | $72,000 | $232,500 |
| 2021 | $4,784 | $194,800 | $45,800 | $149,000 |
| 2020 | $4,784 | $194,800 | $45,800 | $149,000 |
| 2019 | $4,784 | $194,800 | $45,800 | $149,000 |
| 2018 | $4,177 | $130,700 | $44,400 | $86,300 |
| 2017 | $4,177 | $130,700 | $44,400 | $86,300 |
| 2016 | $4,177 | $130,700 | $44,400 | $86,300 |
| 2015 | $3,790 | $114,500 | $47,100 | $67,400 |
| 2014 | $3,753 | $111,200 | $47,100 | $64,100 |
| 2013 | $3,753 | $111,200 | $47,100 | $64,100 |
Source: Public Records
Map
Nearby Homes
- 198 Eastwood Ave
- 94 Laurel Hill Ave
- 90 Laurel Hill Ave
- 194 Eastwood Ave
- 98 Laurel Hill Ave
- 201 Laban St
- 195 Laban St
- 190 Eastwood Ave Unit 192
- 193 Laban St
- 205 Eastwood Ave
- 205 Eastwood Ave Unit 2
- 201 Eastwood Ave
- 108 Laurel Hill Ave
- 203 Eastwood Ave
- 209 Eastwood Ave
- 199 Eastwood Ave
- 183 Laban St
- 186 Eastwood Ave
- 195 Eastwood Ave
- 89 Laurel Hill Ave