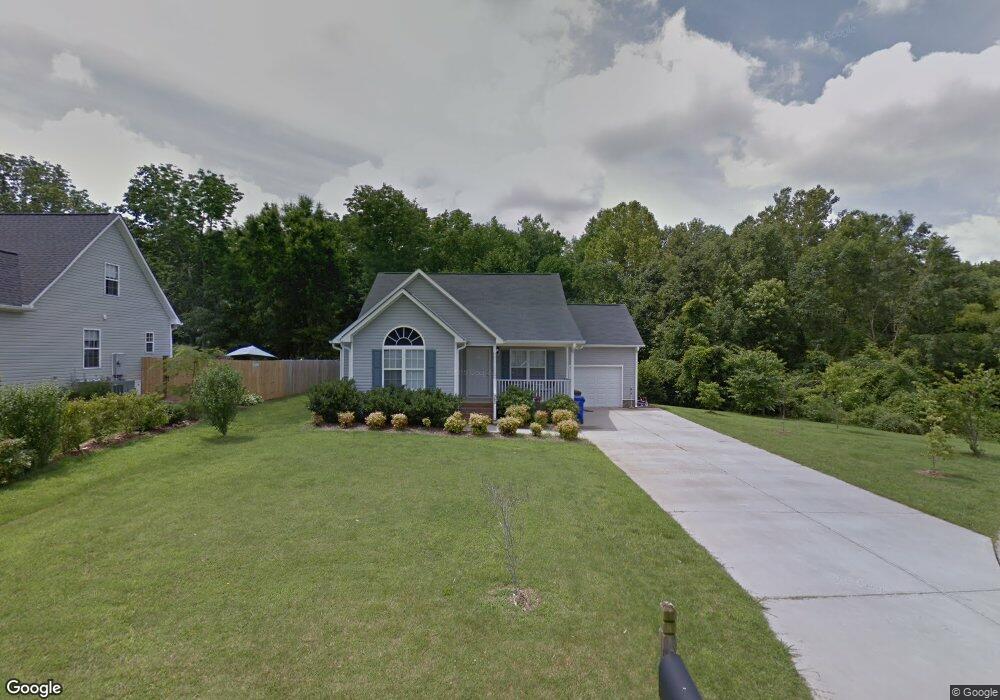
202 Esteban Ct Mebane, NC 27302
Estimated Value: $291,000 - $316,000
3
Beds
2
Baths
1,252
Sq Ft
$243/Sq Ft
Est. Value
About This Home
This home is located at 202 Esteban Ct, Mebane, NC 27302 and is currently estimated at $304,614, approximately $243 per square foot. 202 Esteban Ct is a home located in Alamance County with nearby schools including E.M. Yoder Elementary School, Woodlawn Middle School, and Eastern Alamance High School.
Ownership History
Date
Name
Owned For
Owner Type
Purchase Details
Closed on
Sep 26, 2016
Sold by
Werner Beverly G
Bought by
Garner Daniel L
Current Estimated Value
Home Financials for this Owner
Home Financials are based on the most recent Mortgage that was taken out on this home.
Original Mortgage
$99,875
Outstanding Balance
$79,992
Interest Rate
3.43%
Mortgage Type
New Conventional
Estimated Equity
$224,622
Purchase Details
Closed on
Feb 16, 2007
Sold by
Freeland Construction Co
Bought by
Garner Daniel L
Home Financials for this Owner
Home Financials are based on the most recent Mortgage that was taken out on this home.
Original Mortgage
$50,000
Interest Rate
6.08%
Mortgage Type
New Conventional
Purchase Details
Closed on
Oct 12, 2006
Sold by
North 5Th Street Llc
Bought by
Freeland And Const Co
Home Financials for this Owner
Home Financials are based on the most recent Mortgage that was taken out on this home.
Original Mortgage
$120,000
Interest Rate
6.36%
Mortgage Type
New Conventional
Create a Home Valuation Report for This Property
The Home Valuation Report is an in-depth analysis detailing your home's value as well as a comparison with similar homes in the area
Home Values in the Area
Average Home Value in this Area
Purchase History
| Date | Buyer | Sale Price | Title Company |
|---|---|---|---|
| Garner Daniel L | -- | None Available | |
| Garner Daniel L | $151,000 | -- | |
| Freeland And Const Co | $34,000 | -- |
Source: Public Records
Mortgage History
| Date | Status | Borrower | Loan Amount |
|---|---|---|---|
| Open | Garner Daniel L | $99,875 | |
| Previous Owner | Garner Daniel L | $50,000 | |
| Previous Owner | Garner Daniel L | $100,239 | |
| Previous Owner | Freeland And Const Co | $120,000 |
Source: Public Records
Tax History Compared to Growth
Tax History
| Year | Tax Paid | Tax Assessment Tax Assessment Total Assessment is a certain percentage of the fair market value that is determined by local assessors to be the total taxable value of land and additions on the property. | Land | Improvement |
|---|---|---|---|---|
| 2025 | $2,626 | $303,893 | $55,000 | $248,893 |
| 2024 | $2,550 | $303,893 | $55,000 | $248,893 |
| 2023 | $2,425 | $303,893 | $55,000 | $248,893 |
| 2022 | $1,722 | $154,492 | $35,000 | $119,492 |
| 2021 | $1,737 | $154,492 | $35,000 | $119,492 |
| 2020 | $1,752 | $154,492 | $35,000 | $119,492 |
| 2019 | $1,761 | $154,492 | $35,000 | $119,492 |
| 2018 | $0 | $154,492 | $35,000 | $119,492 |
| 2017 | $1,614 | $154,492 | $35,000 | $119,492 |
| 2016 | $1,646 | $153,826 | $30,000 | $123,826 |
| 2015 | $888 | $153,826 | $30,000 | $123,826 |
| 2014 | -- | $153,826 | $30,000 | $123,826 |
Source: Public Records
Map
Nearby Homes
- 205 Esteban Ct
- 901 N Fifth St
- 407 N Ninth St
- 705 E Ashland Dr
- 112 N Sixth St
- L279-280 N 10th St
- L277-278 N 10th St
- L37-41 N 10th St
- 409 Reinsman Ct
- 609 Village Lake Dr
- 603 Village Lake Dr
- 1012 Lake Michael Way
- 638 Village Lake Dr
- 503 E Graham St
- Lot# 2 Highway 70 E
- 701 N Carr St
- 402 W Clay St
- 906 Beeline Ln
- 513 N Carr St
- 104 E Wilson St
- 204 Esteban Ct
- 206 Esteban Ct
- 200 E Sebastian Ct
- 207 Esteban Ct
- 202 E Sebastian Ct
- 201 Esteban Ct
- 503 Beaver Creek Dr
- 203 Esteban Ct
- 208 Esteban Ct
- 209 Esteban Ct
- 201 E Sebastian Ct
- 211 Esteban Ct
- 212 Drake Ln
- 212 E Drake Ln
- 210 Drake Ln
- 84 Esteban Ct
- 210 E Drake Ln
- 214 Drake Ln
- 214 E Drake Ln
- 802 N 5th St