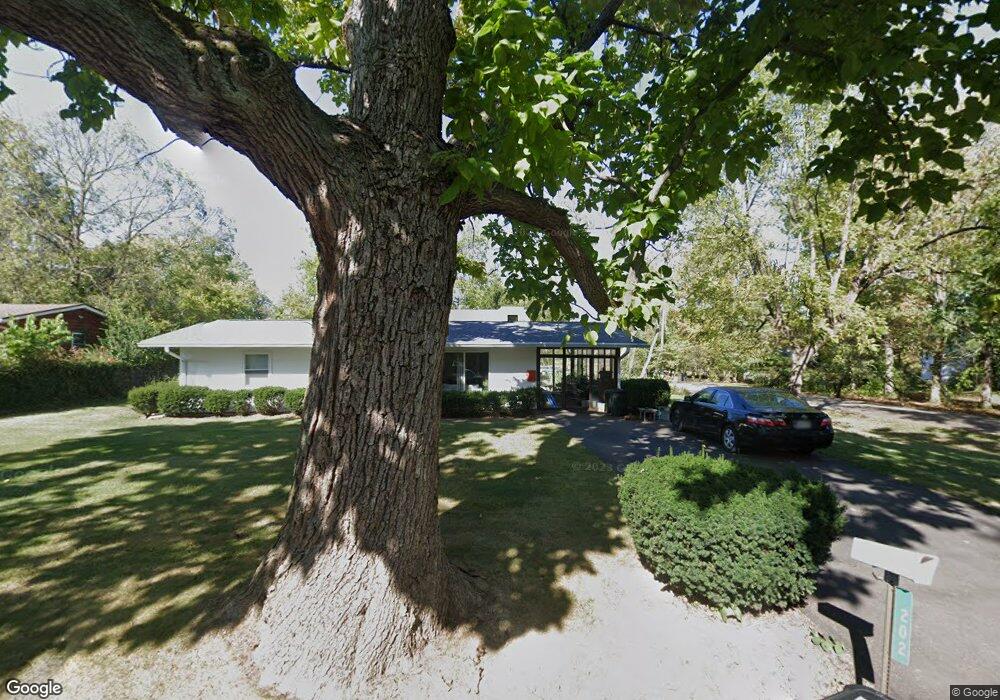
202 Fairfield Pike Yellow Springs, OH 45387
Estimated Value: $300,000 - $429,000
3
Beds
1
Bath
960
Sq Ft
$406/Sq Ft
Est. Value
About This Home
This home is located at 202 Fairfield Pike, Yellow Springs, OH 45387 and is currently estimated at $389,482, approximately $405 per square foot. 202 Fairfield Pike is a home located in Greene County with nearby schools including Mills Lawn Elementary School, Yellow Springs High School & McKinney Middle School, and The Antioch School.
Ownership History
Date
Name
Owned For
Owner Type
Purchase Details
Closed on
May 30, 2025
Sold by
Myers Ashley J and Myers Joshua
Bought by
Ellexson Leigh and Ellexson Gary
Current Estimated Value
Home Financials for this Owner
Home Financials are based on the most recent Mortgage that was taken out on this home.
Original Mortgage
$295,100
Outstanding Balance
$294,335
Interest Rate
6.76%
Mortgage Type
New Conventional
Estimated Equity
$95,147
Purchase Details
Closed on
Nov 9, 2020
Sold by
Malucci Jason Anthony
Bought by
Myers Ashley J and Myers Joshua
Home Financials for this Owner
Home Financials are based on the most recent Mortgage that was taken out on this home.
Original Mortgage
$164,250
Interest Rate
2.8%
Mortgage Type
New Conventional
Purchase Details
Closed on
Jul 15, 2020
Sold by
Chaney Ruth N
Bought by
Malucci Jason Anthony
Purchase Details
Closed on
Apr 11, 2016
Sold by
Chaney Reuben E and Chaney Ruth
Bought by
Chaney Reuben E and Chaney Ruth
Create a Home Valuation Report for This Property
The Home Valuation Report is an in-depth analysis detailing your home's value as well as a comparison with similar homes in the area
Home Values in the Area
Average Home Value in this Area
Purchase History
| Date | Buyer | Sale Price | Title Company |
|---|---|---|---|
| Ellexson Leigh | $439,000 | Red Letter Title | |
| Myers Ashley J | $219,000 | Crown Techne Title Agency | |
| Malucci Jason Anthony | $140,000 | None Available | |
| Chancy Ruth N | -- | None Available | |
| Chaney Reuben E | -- | None Available |
Source: Public Records
Mortgage History
| Date | Status | Borrower | Loan Amount |
|---|---|---|---|
| Open | Ellexson Leigh | $295,100 | |
| Previous Owner | Myers Ashley J | $164,250 |
Source: Public Records
Tax History Compared to Growth
Tax History
| Year | Tax Paid | Tax Assessment Tax Assessment Total Assessment is a certain percentage of the fair market value that is determined by local assessors to be the total taxable value of land and additions on the property. | Land | Improvement |
|---|---|---|---|---|
| 2024 | $7,274 | $127,760 | $25,290 | $102,470 |
| 2023 | $7,274 | $127,760 | $25,290 | $102,470 |
| 2022 | $3,796 | $63,130 | $21,780 | $41,350 |
| 2021 | $3,740 | $55,200 | $21,780 | $33,420 |
| 2020 | $3,208 | $55,200 | $21,780 | $33,420 |
| 2019 | $2,437 | $47,930 | $19,060 | $28,870 |
| 2018 | $2,430 | $47,930 | $19,060 | $28,870 |
| 2017 | $2,399 | $47,930 | $19,060 | $28,870 |
| 2016 | $2,090 | $42,930 | $18,280 | $24,650 |
| 2015 | $1,062 | $42,930 | $18,280 | $24,650 |
| 2014 | $1,025 | $42,930 | $18,280 | $24,650 |
Source: Public Records
Map
Nearby Homes
- 235 Northwood Dr
- 0 Xenia Ave Unit 934833
- 0 Xenia Ave Unit 1038888
- 425 Snowdrop Dr
- 4410 Us Route 68 N
- 602 Keystone Ct
- 513 Lincoln Ct
- 260 King St
- 504 Phillips St
- 414 S High St
- 125 Park Meadows Dr
- 404 Snowdrop Dr
- Danville Plan at Spring Meadows - Maple Street Collection
- Beacon Plan at Spring Meadows - Maple Street Collection
- DaVinci Plan at Spring Meadows - Maple Street Collection
- Cumberland Plan at Spring Meadows - Maple Street Collection
- Greenbriar Plan at Spring Meadows - Maple Street Collection
- Wesley Plan at Spring Meadows - Maple Street Collection
- Jensen Plan at Spring Meadows - Maple Street Collection
- Fairfax Plan at Spring Meadows - Maple Street Collection
- 210 Fairfield Pike
- 414 Polecat Rd
- 216 Fairfield Pike
- 207 Fairfield Pike
- 211 Fairfield Pike
- 413 Polecat Rd
- 215 Fairfield Pike
- 422 Polecat Rd
- 215 Yellow Springs Fairfie Rd
- 231 Whitehall Dr
- 222 Fairfield Pike
- 227 Whitehall Dr
- 425 N Winter St
- 322 N Walnut St
- 210 Dawson St
- 430 Polecat Rd
- 214 Dawson St
- 235 Whitehall Dr
- 223 Whitehall Dr
- 321 N Walnut St