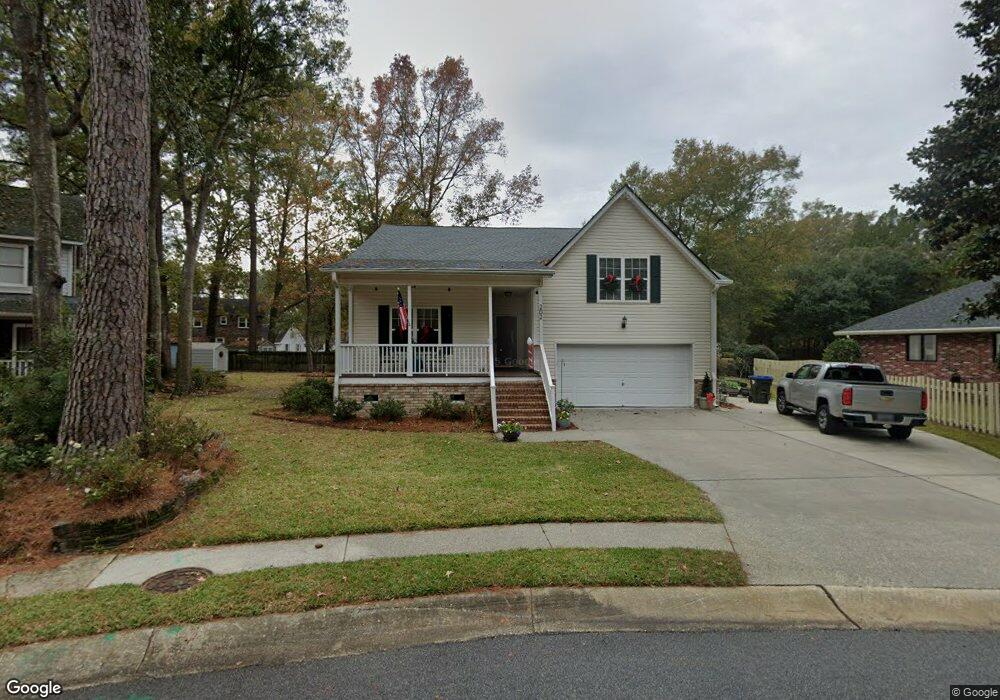
202 Fox Squirrel Run Summerville, SC 29483
Estimated Value: $441,000 - $567,000
4
Beds
3
Baths
2,063
Sq Ft
$238/Sq Ft
Est. Value
About This Home
This home is located at 202 Fox Squirrel Run, Summerville, SC 29483 and is currently estimated at $490,251, approximately $237 per square foot. 202 Fox Squirrel Run is a home located in Berkeley County with nearby schools including Sangaree Elementary School, Sangaree Intermediate School, and Sangaree Middle School.
Ownership History
Date
Name
Owned For
Owner Type
Purchase Details
Closed on
Dec 12, 2011
Sold by
Mcdougald John G and Mcdougald Joann L
Bought by
Mcdougald John Gordon and Mcdougald Joe Ann L
Current Estimated Value
Home Financials for this Owner
Home Financials are based on the most recent Mortgage that was taken out on this home.
Original Mortgage
$157,500
Outstanding Balance
$107,999
Interest Rate
4.06%
Mortgage Type
Future Advance Clause Open End Mortgage
Estimated Equity
$382,252
Purchase Details
Closed on
Mar 24, 2006
Sold by
Moody Tabitha L and Moody Dallas F
Bought by
Mcdougald John G and Mcdougald Joann L
Home Financials for this Owner
Home Financials are based on the most recent Mortgage that was taken out on this home.
Original Mortgage
$165,000
Interest Rate
6.25%
Mortgage Type
Future Advance Clause Open End Mortgage
Purchase Details
Closed on
May 14, 2002
Sold by
Jean Collins Patricia
Bought by
Harold Tyner Development Corp
Create a Home Valuation Report for This Property
The Home Valuation Report is an in-depth analysis detailing your home's value as well as a comparison with similar homes in the area
Home Values in the Area
Average Home Value in this Area
Purchase History
| Date | Buyer | Sale Price | Title Company |
|---|---|---|---|
| Mcdougald John Gordon | -- | -- | |
| Mcdougald John G | $220,000 | None Available | |
| Harold Tyner Development Corp | $20,000 | -- |
Source: Public Records
Mortgage History
| Date | Status | Borrower | Loan Amount |
|---|---|---|---|
| Open | Mcdougald John Gordon | $157,500 | |
| Closed | Mcdougald John G | $165,000 |
Source: Public Records
Tax History Compared to Growth
Tax History
| Year | Tax Paid | Tax Assessment Tax Assessment Total Assessment is a certain percentage of the fair market value that is determined by local assessors to be the total taxable value of land and additions on the property. | Land | Improvement |
|---|---|---|---|---|
| 2025 | $1,539 | $275,345 | $46,428 | $228,917 |
| 2024 | $1,389 | $11,014 | $1,857 | $9,157 |
| 2023 | $1,389 | $11,014 | $1,857 | $9,157 |
| 2022 | $1,301 | $9,578 | $1,400 | $8,178 |
| 2021 | $1,295 | $9,580 | $1,400 | $8,178 |
| 2020 | $1,233 | $9,578 | $1,400 | $8,178 |
| 2019 | $1,191 | $9,578 | $1,400 | $8,178 |
| 2018 | $1,048 | $8,328 | $1,600 | $6,728 |
| 2017 | $1,021 | $8,328 | $1,600 | $6,728 |
| 2016 | $1,073 | $8,330 | $1,600 | $6,730 |
| 2015 | $963 | $8,330 | $1,600 | $6,730 |
| 2014 | $990 | $8,330 | $1,600 | $6,730 |
| 2013 | -- | $8,330 | $1,600 | $6,730 |
Source: Public Records
Map
Nearby Homes
- 2604 Poplar Grove Place
- 195 Fox Squirrel Run
- 3903 Poplar Grove Place
- 103 Littlejohn St
- 608 S Pointe Blvd
- 602 Pond Pine Trail
- 1800 Poplar Grove Place
- 802 S Pointe Blvd
- 500 Yellow Hawthorn Cir
- 1602 Poplar Grove Place
- 804 S Pointe Blvd
- 1402 Poplar Grove Place
- 701 Pine Bluff Dr
- 112 True Grit Way
- 105 Limerick Cir
- 101 Limerick Cir
- 1304 Elm Hall Cir
- 194 Dolce Ln
- 206 Eastover Cir
- 133 W Park Ln
- 307 Mcdougal Cir
- 204 Fox Squirrel Run
- 305 Mcdougal Cir
- 203 Dundee St
- 201 Dundee St
- 207 Fox Squirrel Run
- 206 Fox Squirrel Run
- 205 Dundee St
- 205 Fox Squirrel Run
- 310 Mcdougal Cir
- 209 Fox Squirrel Run
- 208 Fox Squirrel Run
- 201 Fox Squirrel Run
- 203 Fox Squirrel Run
- 197 Dundee St
- 104 Glasgow Cir
- 202 Dundee St
- 308 Mcdougal Cir
- 200 Dundee St
- 189 Edinburgh St