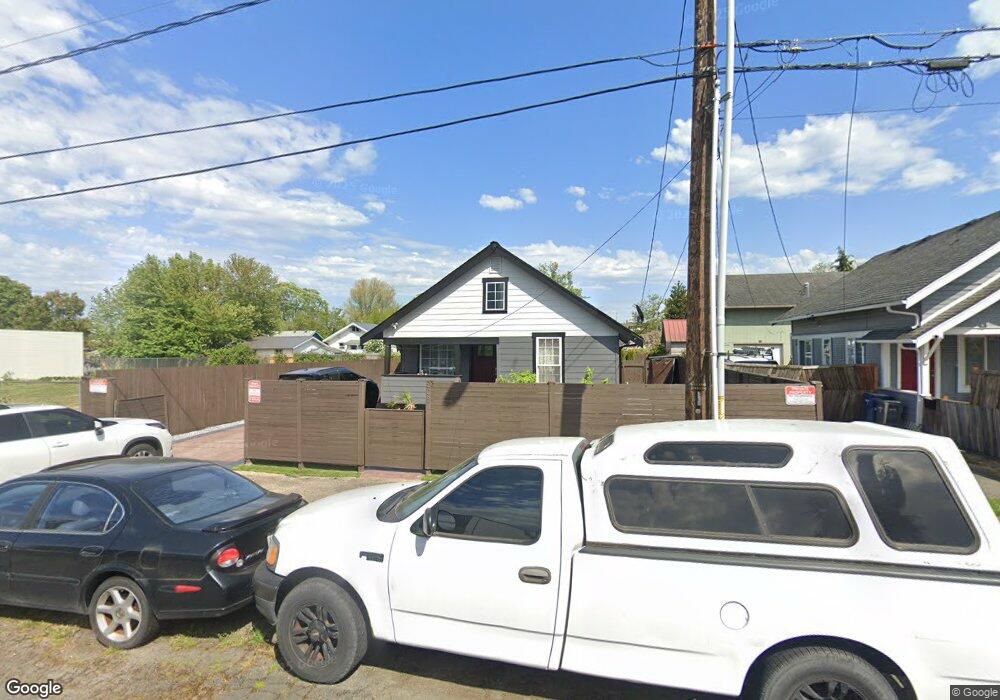
202 G St SW Auburn, WA 98001
Downtown Auburn NeighborhoodEstimated Value: $345,000 - $430,672
3
Beds
1
Bath
1,040
Sq Ft
$366/Sq Ft
Est. Value
About This Home
This home is located at 202 G St SW, Auburn, WA 98001 and is currently estimated at $380,918, approximately $366 per square foot. 202 G St SW is a home located in King County with nearby schools including Washington Elementary School, Cascade Middle School, and Auburn High School.
Ownership History
Date
Name
Owned For
Owner Type
Purchase Details
Closed on
Jun 22, 2018
Sold by
Miller Jerold A and Miller Rondi M
Bought by
Ortiz Ii Hector
Current Estimated Value
Home Financials for this Owner
Home Financials are based on the most recent Mortgage that was taken out on this home.
Original Mortgage
$208,550
Outstanding Balance
$180,361
Interest Rate
4.5%
Mortgage Type
New Conventional
Estimated Equity
$200,557
Purchase Details
Closed on
Apr 30, 2002
Sold by
Wheeler Theron H
Bought by
Miller Jerold A and Miller Rondi M
Create a Home Valuation Report for This Property
The Home Valuation Report is an in-depth analysis detailing your home's value as well as a comparison with similar homes in the area
Home Values in the Area
Average Home Value in this Area
Purchase History
| Date | Buyer | Sale Price | Title Company |
|---|---|---|---|
| Ortiz Ii Hector | $215,000 | Chicago Title | |
| Miller Jerold A | $30,000 | Transnation Title |
Source: Public Records
Mortgage History
| Date | Status | Borrower | Loan Amount |
|---|---|---|---|
| Open | Ortiz Ii Hector | $208,550 |
Source: Public Records
Tax History Compared to Growth
Tax History
| Year | Tax Paid | Tax Assessment Tax Assessment Total Assessment is a certain percentage of the fair market value that is determined by local assessors to be the total taxable value of land and additions on the property. | Land | Improvement |
|---|---|---|---|---|
| 2024 | $4,449 | $371,000 | $127,000 | $244,000 |
| 2023 | $3,955 | $326,000 | $102,000 | $224,000 |
| 2022 | $3,653 | $341,000 | $111,000 | $230,000 |
| 2021 | $3,412 | $271,000 | $89,000 | $182,000 |
| 2020 | $3,107 | $239,000 | $83,000 | $156,000 |
| 2018 | $2,643 | $185,000 | $80,000 | $105,000 |
| 2017 | $2,183 | $164,000 | $73,000 | $91,000 |
| 2016 | $1,926 | $134,000 | $70,000 | $64,000 |
| 2015 | $1,904 | $125,000 | $65,000 | $60,000 |
| 2014 | -- | $120,000 | $62,000 | $58,000 |
| 2013 | -- | $92,000 | $57,000 | $35,000 |
Source: Public Records
Map
Nearby Homes