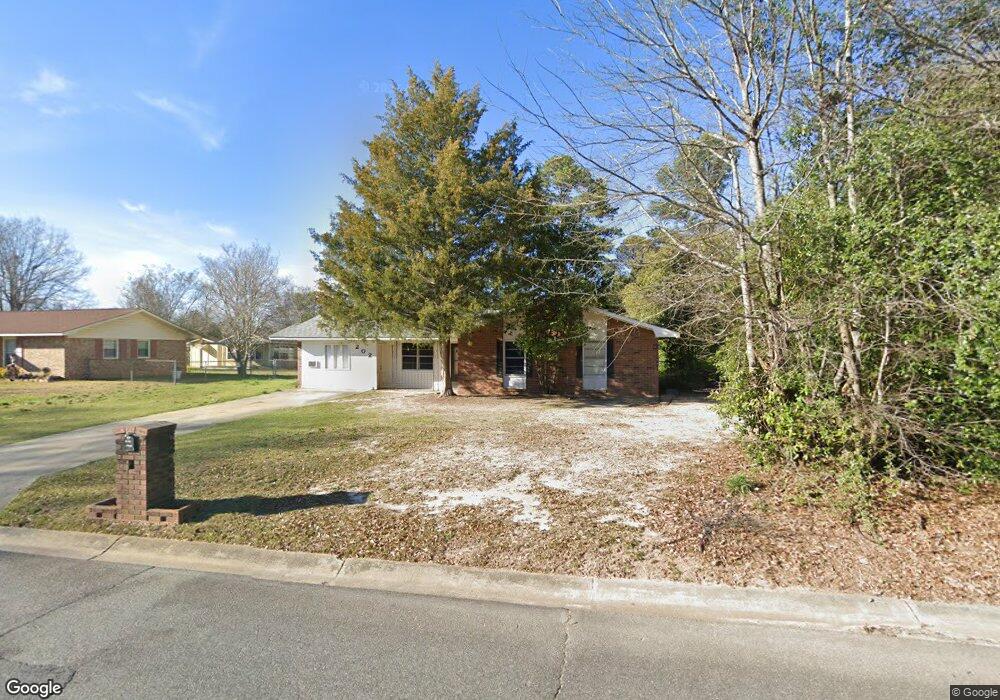
202 Galahad Dr Warner Robins, GA 31093
Estimated Value: $190,192 - $226,000
4
Beds
2
Baths
2,256
Sq Ft
$92/Sq Ft
Est. Value
About This Home
This home is located at 202 Galahad Dr, Warner Robins, GA 31093 and is currently estimated at $206,548, approximately $91 per square foot. 202 Galahad Dr is a home located in Houston County with nearby schools including Parkwood Elementary School, Northside Middle School, and Northside High School.
Ownership History
Date
Name
Owned For
Owner Type
Purchase Details
Closed on
Aug 31, 2007
Sold by
Neisler Jeff
Bought by
Smith Ken
Current Estimated Value
Purchase Details
Closed on
Jun 5, 2007
Sold by
Welch Robert E and Welch Earnest Dean
Bought by
Neisler Jeff
Purchase Details
Closed on
Dec 8, 2000
Sold by
Welch Robert E
Bought by
Welch Earnest Dean
Purchase Details
Closed on
Dec 30, 1991
Sold by
Assoc Fin Svcs Of America Inc
Bought by
Welch Robert E and Earnest Dean
Purchase Details
Closed on
Dec 3, 1991
Sold by
Robinson Billie Sue
Bought by
Assoc Fin Svcs Of America Inc
Purchase Details
Closed on
Apr 18, 1988
Sold by
Assoc Fin Svcs Of America Inc
Bought by
Robinson Billie Sue
Purchase Details
Closed on
Apr 5, 1988
Sold by
Alexander Christine
Bought by
Assoc Fin Svcs Of America Inc
Purchase Details
Closed on
Dec 22, 1970
Sold by
Selph Construction & Dev Co In
Bought by
Alexander Christine
Purchase Details
Closed on
May 29, 1970
Bought by
Selph Construction & Dev Co Inc
Create a Home Valuation Report for This Property
The Home Valuation Report is an in-depth analysis detailing your home's value as well as a comparison with similar homes in the area
Home Values in the Area
Average Home Value in this Area
Purchase History
| Date | Buyer | Sale Price | Title Company |
|---|---|---|---|
| Smith Ken | $58,000 | None Available | |
| Neisler Jeff | $53,000 | None Available | |
| Welch Earnest Dean | -- | -- | |
| Welch Robert E | $42,500 | -- | |
| Assoc Fin Svcs Of America Inc | $44,100 | -- | |
| Robinson Billie Sue | -- | -- | |
| Assoc Fin Svcs Of America Inc | -- | -- | |
| Alexander Christine | -- | -- | |
| Selph Construction & Dev Co Inc | -- | -- |
Source: Public Records
Tax History Compared to Growth
Tax History
| Year | Tax Paid | Tax Assessment Tax Assessment Total Assessment is a certain percentage of the fair market value that is determined by local assessors to be the total taxable value of land and additions on the property. | Land | Improvement |
|---|---|---|---|---|
| 2024 | $1,691 | $51,680 | $8,000 | $43,680 |
| 2023 | $1,418 | $43,000 | $8,000 | $35,000 |
| 2022 | $855 | $37,200 | $5,400 | $31,800 |
| 2021 | $765 | $33,080 | $5,400 | $27,680 |
| 2020 | $325 | $32,520 | $5,400 | $27,120 |
| 2019 | $756 | $32,520 | $5,400 | $27,120 |
| 2018 | $756 | $35,400 | $5,400 | $30,000 |
| 2017 | $823 | $35,400 | $5,400 | $30,000 |
| 2016 | $824 | $35,400 | $5,400 | $30,000 |
| 2015 | -- | $35,400 | $5,400 | $30,000 |
| 2014 | -- | $35,400 | $5,400 | $30,000 |
| 2013 | -- | $35,400 | $5,400 | $30,000 |
Source: Public Records
Map
Nearby Homes
- 152 Rock Run Trail
- 131 Martin Mill Trail
- 107 Galahad Dr
- 118 Avalon Dr
- 208 Pellimore Dr
- 857 Ola Dr
- 112 Emory Dr
- 303 Pinecrest Dr
- 106 Tor Dr
- 317 Emory Dr
- 115 Wray St
- 725 B East Side Dr
- 709 Meadowridge Dr
- 102 Montiego Ct
- 719 Meadowridge Dr
- 112 Willow Glen
- 110 Foxfire Dr
- 221 Gilchrist Dr
- 156 Red Birch Ln
- 204 Galahad Dr
- 201 Avalon Dr
- 110 Bedivere Dr
- 108 Bedivere Dr
- 206 Galahad Dr
- 203 Avalon Dr
- 203 Galahad Dr
- 0 Galahad Dr Unit 7199561
- 0 Galahad Dr
- 205 Galahad Dr
- 106 Bedivere Dr
- 207 Galahad Dr
- 208 Galahad Dr
- 104 Bedivere Dr
- 111 Lancelot Ct
- 101 Lancelot Ct
- 131 Avalon Dr
- 109 Bedivere Dr
- 107 Bedivere Dr
- 301 Avalon Dr