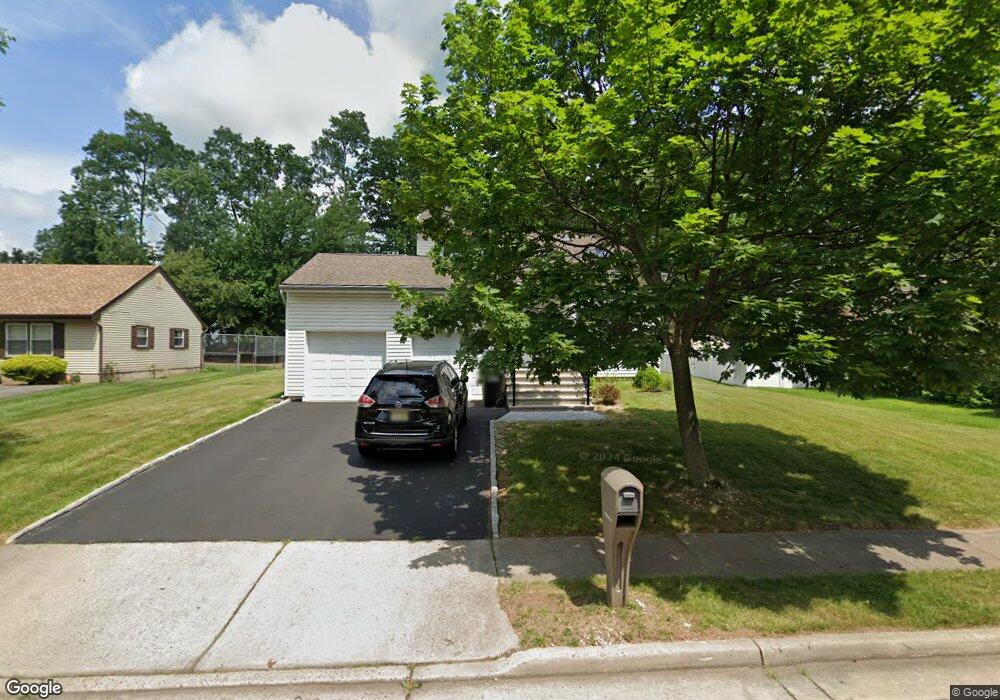
202 Garfield St Edison, NJ 08820
Estimated Value: $666,018 - $948,000
Studio
--
Bath
1,533
Sq Ft
$542/Sq Ft
Est. Value
About This Home
This home is located at 202 Garfield St, Edison, NJ 08820 and is currently estimated at $830,505, approximately $541 per square foot. 202 Garfield St is a home located in Middlesex County with nearby schools including James Madison Primary School, James Madison Intermediate School, and John Adams Middle School.
Ownership History
Date
Name
Owned For
Owner Type
Purchase Details
Closed on
Dec 1, 1999
Sold by
Patel Rakesh
Bought by
Shah Janak and Shah Gira
Current Estimated Value
Home Financials for this Owner
Home Financials are based on the most recent Mortgage that was taken out on this home.
Original Mortgage
$186,000
Outstanding Balance
$57,656
Interest Rate
7.73%
Estimated Equity
$772,849
Create a Home Valuation Report for This Property
The Home Valuation Report is an in-depth analysis detailing your home's value as well as a comparison with similar homes in the area
Home Values in the Area
Average Home Value in this Area
Purchase History
| Date | Buyer | Sale Price | Title Company |
|---|---|---|---|
| Shah Janak | $236,000 | -- |
Source: Public Records
Mortgage History
| Date | Status | Borrower | Loan Amount |
|---|---|---|---|
| Open | Shah Janak | $186,000 |
Source: Public Records
Tax History
| Year | Tax Paid | Tax Assessment Tax Assessment Total Assessment is a certain percentage of the fair market value that is determined by local assessors to be the total taxable value of land and additions on the property. | Land | Improvement |
|---|---|---|---|---|
| 2025 | $13,424 | $225,500 | $103,600 | $121,900 |
| 2024 | $13,352 | $225,500 | $103,600 | $121,900 |
Source: Public Records
Map
Nearby Homes
- 786 Wood Ave
- 8 Periwinkle Place
- 12 W Clark Place
- 15 New Dover Ave
- 868 Inman Ave
- 973 Ellis Pkwy
- 34 E Prescott Ave
- 80 Gaywood Ave
- 628 New Dover Rd
- 46 Taylor Terrace
- 53 Jordan Rd
- 68 W Edward St
- 28 W Francis St
- 92 W Edward St
- 64 W Francis St
- 8 Normandy Rd
- 372 Willow Way
- 89 W Warren St
- 990 Inman Ave
- 24 Woodland Rd
Your Personal Tour Guide
Ask me questions while you tour the home.