Estimated Value: $78,000 - $135,028
3
Beds
2
Baths
1,872
Sq Ft
$52/Sq Ft
Est. Value
About This Home
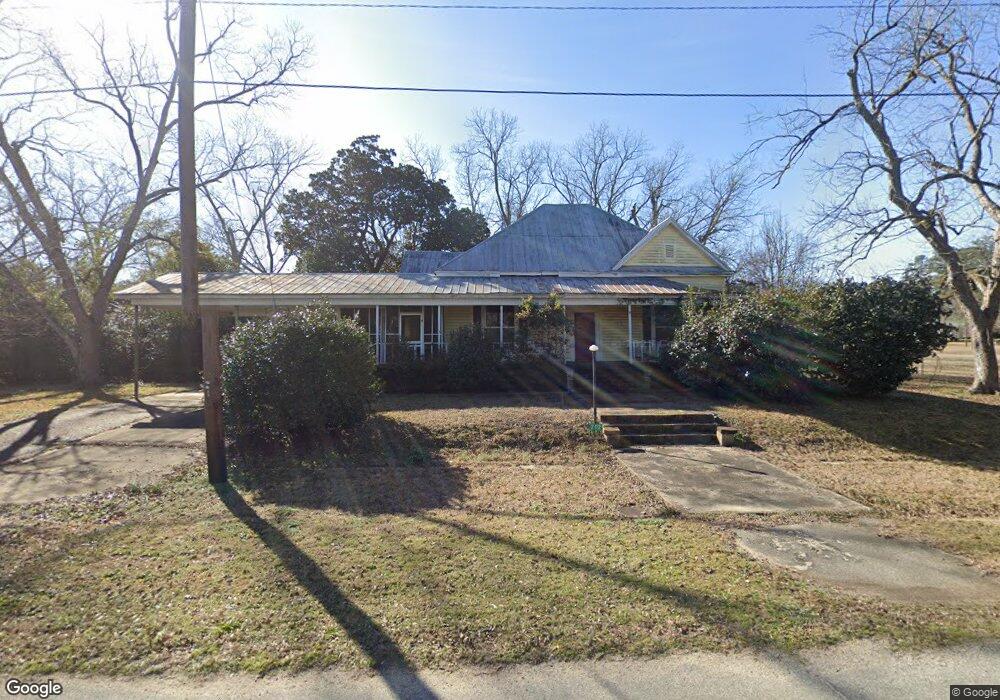
This home is located at 202 Gordon St, Ideal, GA 31041 and is currently estimated at $96,507, approximately $51 per square foot. 202 Gordon St is a home with nearby schools including Macon County Elementary School, Macon County Middle School, and Macon County High School.
Ownership History
Date
Name
Owned For
Owner Type
Purchase Details
Closed on
Mar 12, 2020
Sold by
Matheny Donna B
Bought by
Simmons Joyce
Current Estimated Value
Purchase Details
Closed on
May 4, 2018
Sold by
Maddox Evelyn R
Bought by
Bonner David and Matheny Donna B
Purchase Details
Closed on
Apr 8, 2011
Sold by
Robinson Kenneth E and Robinson Joann B
Bought by
Maddox Evelyn R and Maddox T J
Purchase Details
Closed on
Apr 7, 2009
Sold by
Bancroft Susan
Bought by
Robinson Kenneth
Purchase Details
Closed on
Apr 9, 2007
Sold by
Brooks Aldean
Bought by
Bancroft Susan Ann
Purchase Details
Closed on
Dec 2, 2005
Sold by
Bancroft Susan Ann
Bought by
Brooks Aldean
Purchase Details
Closed on
Jun 7, 2001
Sold by
Priehs Mitchell B
Bought by
Bancroft Susan Ann
Purchase Details
Closed on
Mar 18, 1997
Sold by
Priehs Sybil
Bought by
Priehs Mitchell B
Purchase Details
Closed on
Aug 17, 1995
Sold by
Robinson W S
Bought by
Priehs Sybil
Purchase Details
Closed on
Jan 1, 1944
Bought by
Robinson W S
Create a Home Valuation Report for This Property
The Home Valuation Report is an in-depth analysis detailing your home's value as well as a comparison with similar homes in the area
Home Values in the Area
Average Home Value in this Area
Purchase History
| Date | Buyer | Sale Price | Title Company |
|---|---|---|---|
| Simmons Joyce | -- | -- | |
| Bonner David | $35,000 | -- | |
| Maddox Evelyn R | $60,000 | -- | |
| Robinson Kenneth | $40,951 | -- | |
| Bancroft Susan Ann | -- | -- | |
| Brooks Aldean | -- | -- | |
| Bancroft Susan Ann | $75,000 | -- | |
| Priehs Mitchell B | -- | -- | |
| Priehs Sybil | -- | -- | |
| Robinson W S | -- | -- |
Source: Public Records
Tax History Compared to Growth
Tax History
| Year | Tax Paid | Tax Assessment Tax Assessment Total Assessment is a certain percentage of the fair market value that is determined by local assessors to be the total taxable value of land and additions on the property. | Land | Improvement |
|---|---|---|---|---|
| 2024 | $1,439 | $37,427 | $2,275 | $35,152 |
| 2023 | $1,439 | $37,427 | $2,275 | $35,152 |
| 2022 | $797 | $27,401 | $2,275 | $25,126 |
| 2021 | $830 | $20,795 | $2,275 | $18,520 |
| 2020 | $401 | $20,795 | $2,275 | $18,520 |
| 2019 | $818 | $20,501 | $2,275 | $18,226 |
| 2018 | $626 | $20,501 | $2,275 | $18,226 |
| 2017 | $656 | $21,490 | $1,350 | $20,140 |
| 2016 | $659 | $21,490 | $1,350 | $20,140 |
| 2015 | -- | $24,090 | $1,350 | $22,740 |
| 2014 | -- | $24,090 | $1,350 | $22,740 |
| 2013 | -- | $24,090 | $1,350 | $22,740 |
Source: Public Records
Map
Nearby Homes
- 0 Southland Rd
- 0 Marvis Chapman Rd Unit 24555197
- 0 Marvis Chapman Rd Unit 22366880
- 0 Marvis Chapman Rd Unit 10319071
- 0 Marvis Chapman Rd Unit 10316732
- 11568 Georgia 90
- 4882 Georgia 240
- Ga Hwy 127
- 206 Southland Rd
- 93 Poole Rd
- 367 Georgia 127
- 0 Southland Rd Unit 24700835
- 0 Les Smith Rd
- Parcel 13 Carl Rogers Rd
- Parcel 12 Carl Rogers Rd
- Parcel 8 Carl Rogers Rd
- Parcel 7 Carl Rogers Rd
- Parcel 6 Carl Rogers Rd
- Parcel 5 Carl Rogers Rd
- Les Smith Rd
- 306 Carson Brown Ave
- 102 Gordon St
- 103 Peachtree St
- 0 Peachtree St
- 105 Gordon St
- 304 Poplar St
- 204 Peachtree St
- 302 Peachtree St
- 101 Peachtree St
- 307 Tom Watson Ave
- 303 Tom Watson Ave
- 301 Peachtree St
- 201 Gordon St
- 102 Peachtree St
- 303 Poplar St
- 306 Tom Watson Ave
- 407 Tom Watson Ave
- 203 Tom Watson Ave
- 404 Tom Watson Ave
- 304 Tom Watson Ave