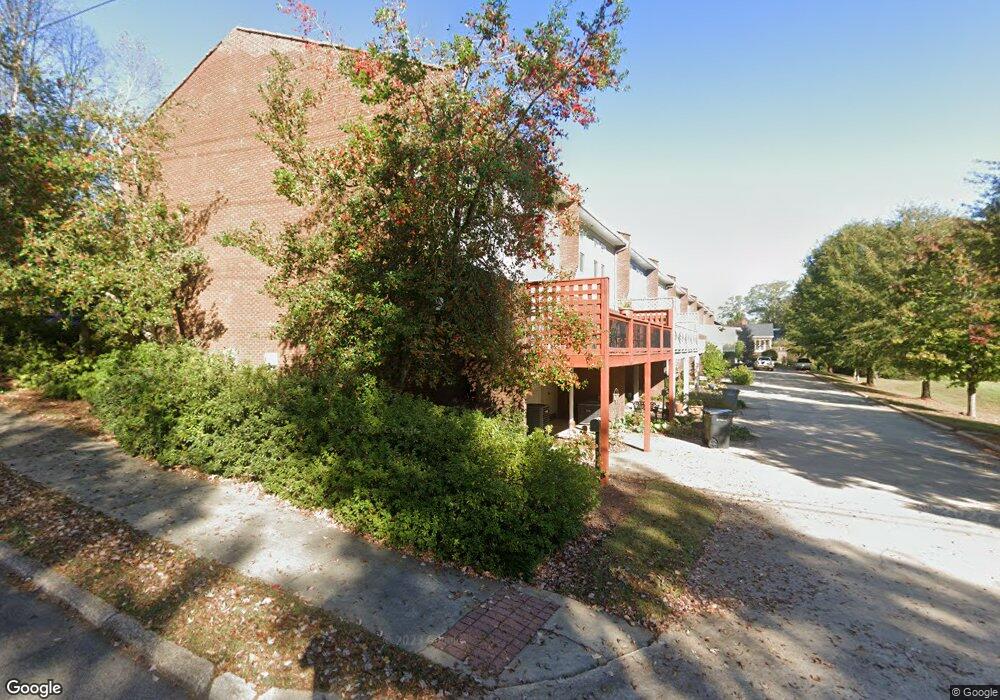
202 Gordon St Lagrange, GA 30240
Estimated Value: $401,000 - $480,484
4
Beds
4
Baths
2,213
Sq Ft
$203/Sq Ft
Est. Value
About This Home
This home is located at 202 Gordon St, Lagrange, GA 30240 and is currently estimated at $448,621, approximately $202 per square foot. 202 Gordon St is a home located in Troup County with nearby schools including Hollis Hand Elementary School, Franklin Forest Elementary School, and Ethel W. Kight Elementary School.
Ownership History
Date
Name
Owned For
Owner Type
Purchase Details
Closed on
Jan 9, 2025
Sold by
Rice William C
Bought by
Rice Helen O
Current Estimated Value
Purchase Details
Closed on
Sep 27, 2022
Sold by
Willingham Maria O
Bought by
Rice William C and Rice Helen O
Home Financials for this Owner
Home Financials are based on the most recent Mortgage that was taken out on this home.
Original Mortgage
$398,000
Interest Rate
5.66%
Mortgage Type
Mortgage Modification
Purchase Details
Closed on
Nov 1, 1999
Sold by
Ellen P Hudson
Bought by
Willey Maria W
Purchase Details
Closed on
Jul 13, 1992
Sold by
Anthony King
Bought by
Ellen P Hudson
Purchase Details
Closed on
Oct 26, 1990
Sold by
Shedd W B
Bought by
Anthony King
Purchase Details
Closed on
May 23, 1988
Sold by
W B and Shedd Divorce Sue S
Bought by
Shedd W B
Purchase Details
Closed on
Dec 18, 1982
Sold by
Mansour'S Dev Corp
Bought by
W B and Shedd Divorce Sue S
Create a Home Valuation Report for This Property
The Home Valuation Report is an in-depth analysis detailing your home's value as well as a comparison with similar homes in the area
Purchase History
| Date | Buyer | Sale Price | Title Company |
|---|---|---|---|
| Rice Helen O | -- | -- | |
| Rice William C | $350,000 | -- | |
| Willey Maria W | $162,000 | -- | |
| Ellen P Hudson | $125,500 | -- | |
| Anthony King | $132,000 | -- | |
| Shedd W B | -- | -- | |
| W B | $120,000 | -- |
Source: Public Records
Mortgage History
| Date | Status | Borrower | Loan Amount |
|---|---|---|---|
| Previous Owner | Rice William C | $398,000 |
Source: Public Records
Tax History
| Year | Tax Paid | Tax Assessment Tax Assessment Total Assessment is a certain percentage of the fair market value that is determined by local assessors to be the total taxable value of land and additions on the property. | Land | Improvement |
|---|---|---|---|---|
| 2025 | $4,131 | $151,480 | $18,000 | $133,480 |
| 2024 | $3,591 | $131,680 | $18,000 | $113,680 |
| 2023 | $2,980 | $109,280 | $18,000 | $91,280 |
| 2022 | $2,893 | $103,640 | $18,000 | $85,640 |
| 2021 | $2,868 | $95,080 | $14,000 | $81,080 |
| 2020 | $2,868 | $95,080 | $14,000 | $81,080 |
| 2019 | $2,816 | $93,360 | $14,000 | $79,360 |
| 2018 | $2,642 | $87,600 | $12,000 | $75,600 |
| 2017 | $2,661 | $88,240 | $12,000 | $76,240 |
| 2016 | $2,642 | $87,604 | $12,000 | $75,604 |
| 2015 | $2,579 | $85,355 | $12,000 | $73,355 |
| 2014 | $2,537 | $83,843 | $12,000 | $71,843 |
| 2013 | -- | $70,982 | $12,000 | $58,982 |
Source: Public Records
Map
Nearby Homes
- 206 Broad St
- 405 W Broome St Unit 2
- 405 W Broome St Unit 3
- 405 W Broome St Unit 4
- 405 W Broome St Unit 1
- 405 W Broome St Unit 5
- 105 Saynor Cir
- 208 Boulevard
- 203 Waverly Way
- 119 College Ave
- 304 Boulevard
- 216 E Lane Cir
- 403 College Ave
- 416 Park Ave
- 421 College Ave
- 505 S Lewis St
- 609 Ridley Ave
- 707 Ridley Ave
- 611 Ridley Ave
- 615 Ridley Ave
- 204 Gordon St
- 200 Gordon St
- 206 Gordon St
- 208 Gordon St Unit 5
- 208 Gordon St
- 210 Gordon St
- 116 Gordon St
- 116 Gordon St Unit 6
- 212 Gordon St
- 114 Gordon St
- 214 Gordon St
- 112 Gordon St
- 216 Gordon St
- 110 Gordon St
- 111 Gordon St
- 201 Gordon St
- 109 Gordon St
- 224 Gordon St
- 107 Gordon St
- 107 Gordon St Unit ON
Your Personal Tour Guide
Ask me questions while you tour the home.