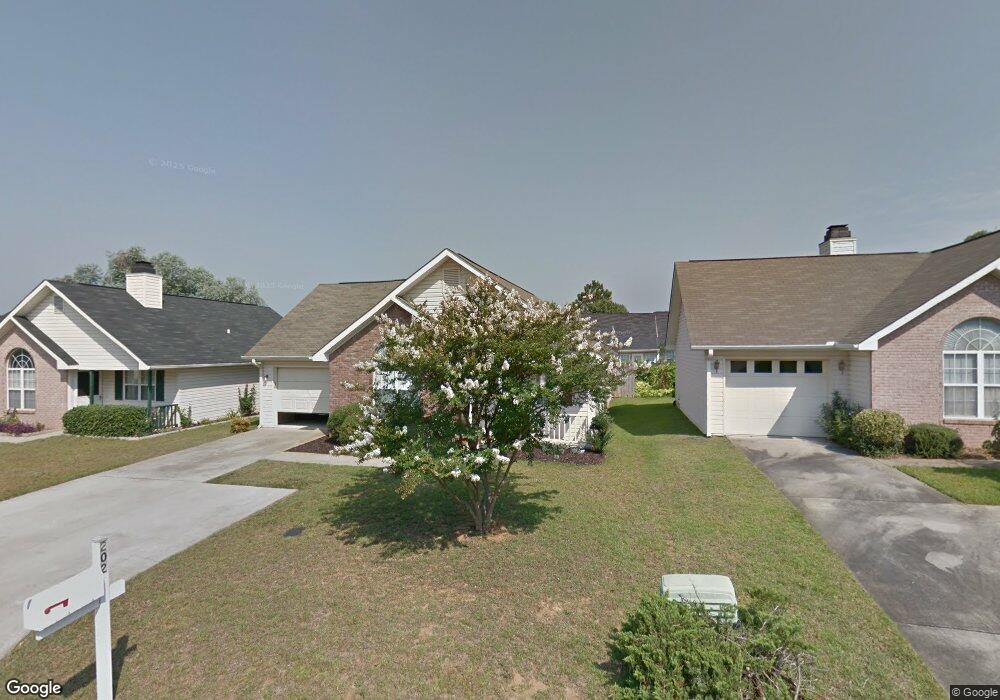
202 Hackamore Ln Warner Robins, GA 31088
Estimated Value: $142,000 - $152,546
2
Beds
2
Baths
1,113
Sq Ft
$132/Sq Ft
Est. Value
About This Home
This home is located at 202 Hackamore Ln, Warner Robins, GA 31088 and is currently estimated at $146,387, approximately $131 per square foot. 202 Hackamore Ln is a home located in Houston County with nearby schools including Quail Run Elementary School, Warner Robins Middle School, and Warner Robins High School.
Ownership History
Date
Name
Owned For
Owner Type
Purchase Details
Closed on
Dec 31, 2020
Sold by
Mcnease Properties Llc
Bought by
Brooks James Andrew
Current Estimated Value
Home Financials for this Owner
Home Financials are based on the most recent Mortgage that was taken out on this home.
Original Mortgage
$92,625
Outstanding Balance
$81,509
Interest Rate
2.7%
Mortgage Type
New Conventional
Estimated Equity
$64,878
Purchase Details
Closed on
Nov 10, 2004
Sold by
Phillips Casey K
Bought by
Mcnease Mischa L
Purchase Details
Closed on
Apr 25, 2003
Sold by
Foshee Timothy J and Janet Mccor
Bought by
Phillips Casey K
Purchase Details
Closed on
Aug 14, 2002
Sold by
Foshee Janet H
Bought by
Foshee Timothy J and Janet Mccord*
Purchase Details
Closed on
Jul 11, 1999
Sold by
Mccord Janet H
Bought by
Foshee Janet H
Purchase Details
Closed on
Oct 27, 1995
Sold by
Bry-Mel Homes Inc
Bought by
Mccord Janet H
Purchase Details
Closed on
Dec 16, 1994
Sold by
Oliver Properties Inc
Bought by
Bry-Mel Homes Inc
Create a Home Valuation Report for This Property
The Home Valuation Report is an in-depth analysis detailing your home's value as well as a comparison with similar homes in the area
Home Values in the Area
Average Home Value in this Area
Purchase History
| Date | Buyer | Sale Price | Title Company |
|---|---|---|---|
| Brooks James Andrew | $97,500 | None Available | |
| Mcnease Mischa L | $76,000 | -- | |
| Phillips Casey K | $73,000 | -- | |
| Foshee Timothy J | -- | -- | |
| Foshee Janet H | -- | -- | |
| Mccord Janet H | $64,400 | -- | |
| Bry-Mel Homes Inc | -- | -- |
Source: Public Records
Mortgage History
| Date | Status | Borrower | Loan Amount |
|---|---|---|---|
| Open | Brooks James Andrew | $92,625 |
Source: Public Records
Tax History
| Year | Tax Paid | Tax Assessment Tax Assessment Total Assessment is a certain percentage of the fair market value that is determined by local assessors to be the total taxable value of land and additions on the property. | Land | Improvement |
|---|---|---|---|---|
| 2025 | $1,498 | $51,440 | $4,800 | $46,640 |
| 2024 | $1,537 | $46,960 | $4,800 | $42,160 |
| 2023 | $1,206 | $36,560 | $4,800 | $31,760 |
| 2022 | $777 | $33,800 | $3,800 | $30,000 |
| 2021 | $717 | $31,000 | $3,800 | $27,200 |
| 2020 | $685 | $29,480 | $3,800 | $25,680 |
| 2019 | $685 | $29,480 | $3,800 | $25,680 |
| 2018 | $685 | $29,480 | $3,800 | $25,680 |
| 2017 | $686 | $29,480 | $3,800 | $25,680 |
| 2016 | $687 | $29,480 | $3,800 | $25,680 |
| 2015 | -- | $29,480 | $3,800 | $25,680 |
| 2014 | -- | $29,480 | $3,800 | $25,680 |
| 2013 | -- | $30,680 | $3,800 | $26,880 |
Source: Public Records
Map
Nearby Homes
- 126 Jaybee Dr
- 100 Grove Ln
- 707 Wilmington Dr
- 112 Holt Ave
- 108 Madison Ave
- 124 Carterwoods Dr
- 105 Maga Ct
- 209 Knodishall Dr
- 105 Jeanette Place
- 209 Deer Track Ct
- 301 Millside Dr
- 111 Hawthorne Rd
- 109 Creek Bluff Trail
- 112 Peacock Dr
- 705 Corder Rd
- 208 Antler Trail
- 416 Knodishall Dr
- 101 Elk Trail
- 214 Mcvey Trail
- 208 Bassett St
- 200 Hackamore Ln
- 204 Hackamore Ln
- 130 Wingate Cir
- 206 Hackamore Ln
- 116 Hackamore Ln
- 114 Hackamore Ln
- 208 Hackamore Ln
- 201 Hackamore Ln
- 124 Wingate Cir
- 112 Hackamore Ln
- 151 Saddlehorn Dr
- 127 Hackamore Ln
- 123 Wingate Cir
- 125 Hackamore Ln
- 110 Hackamore Ln
- 149 Saddlehorn Dr
- 210 Hackamore Ln
- 123 Hackamore Ln
- 134 Sussex Dr
- 108 Hackamore Ln
Your Personal Tour Guide
Ask me questions while you tour the home.